Analysis
41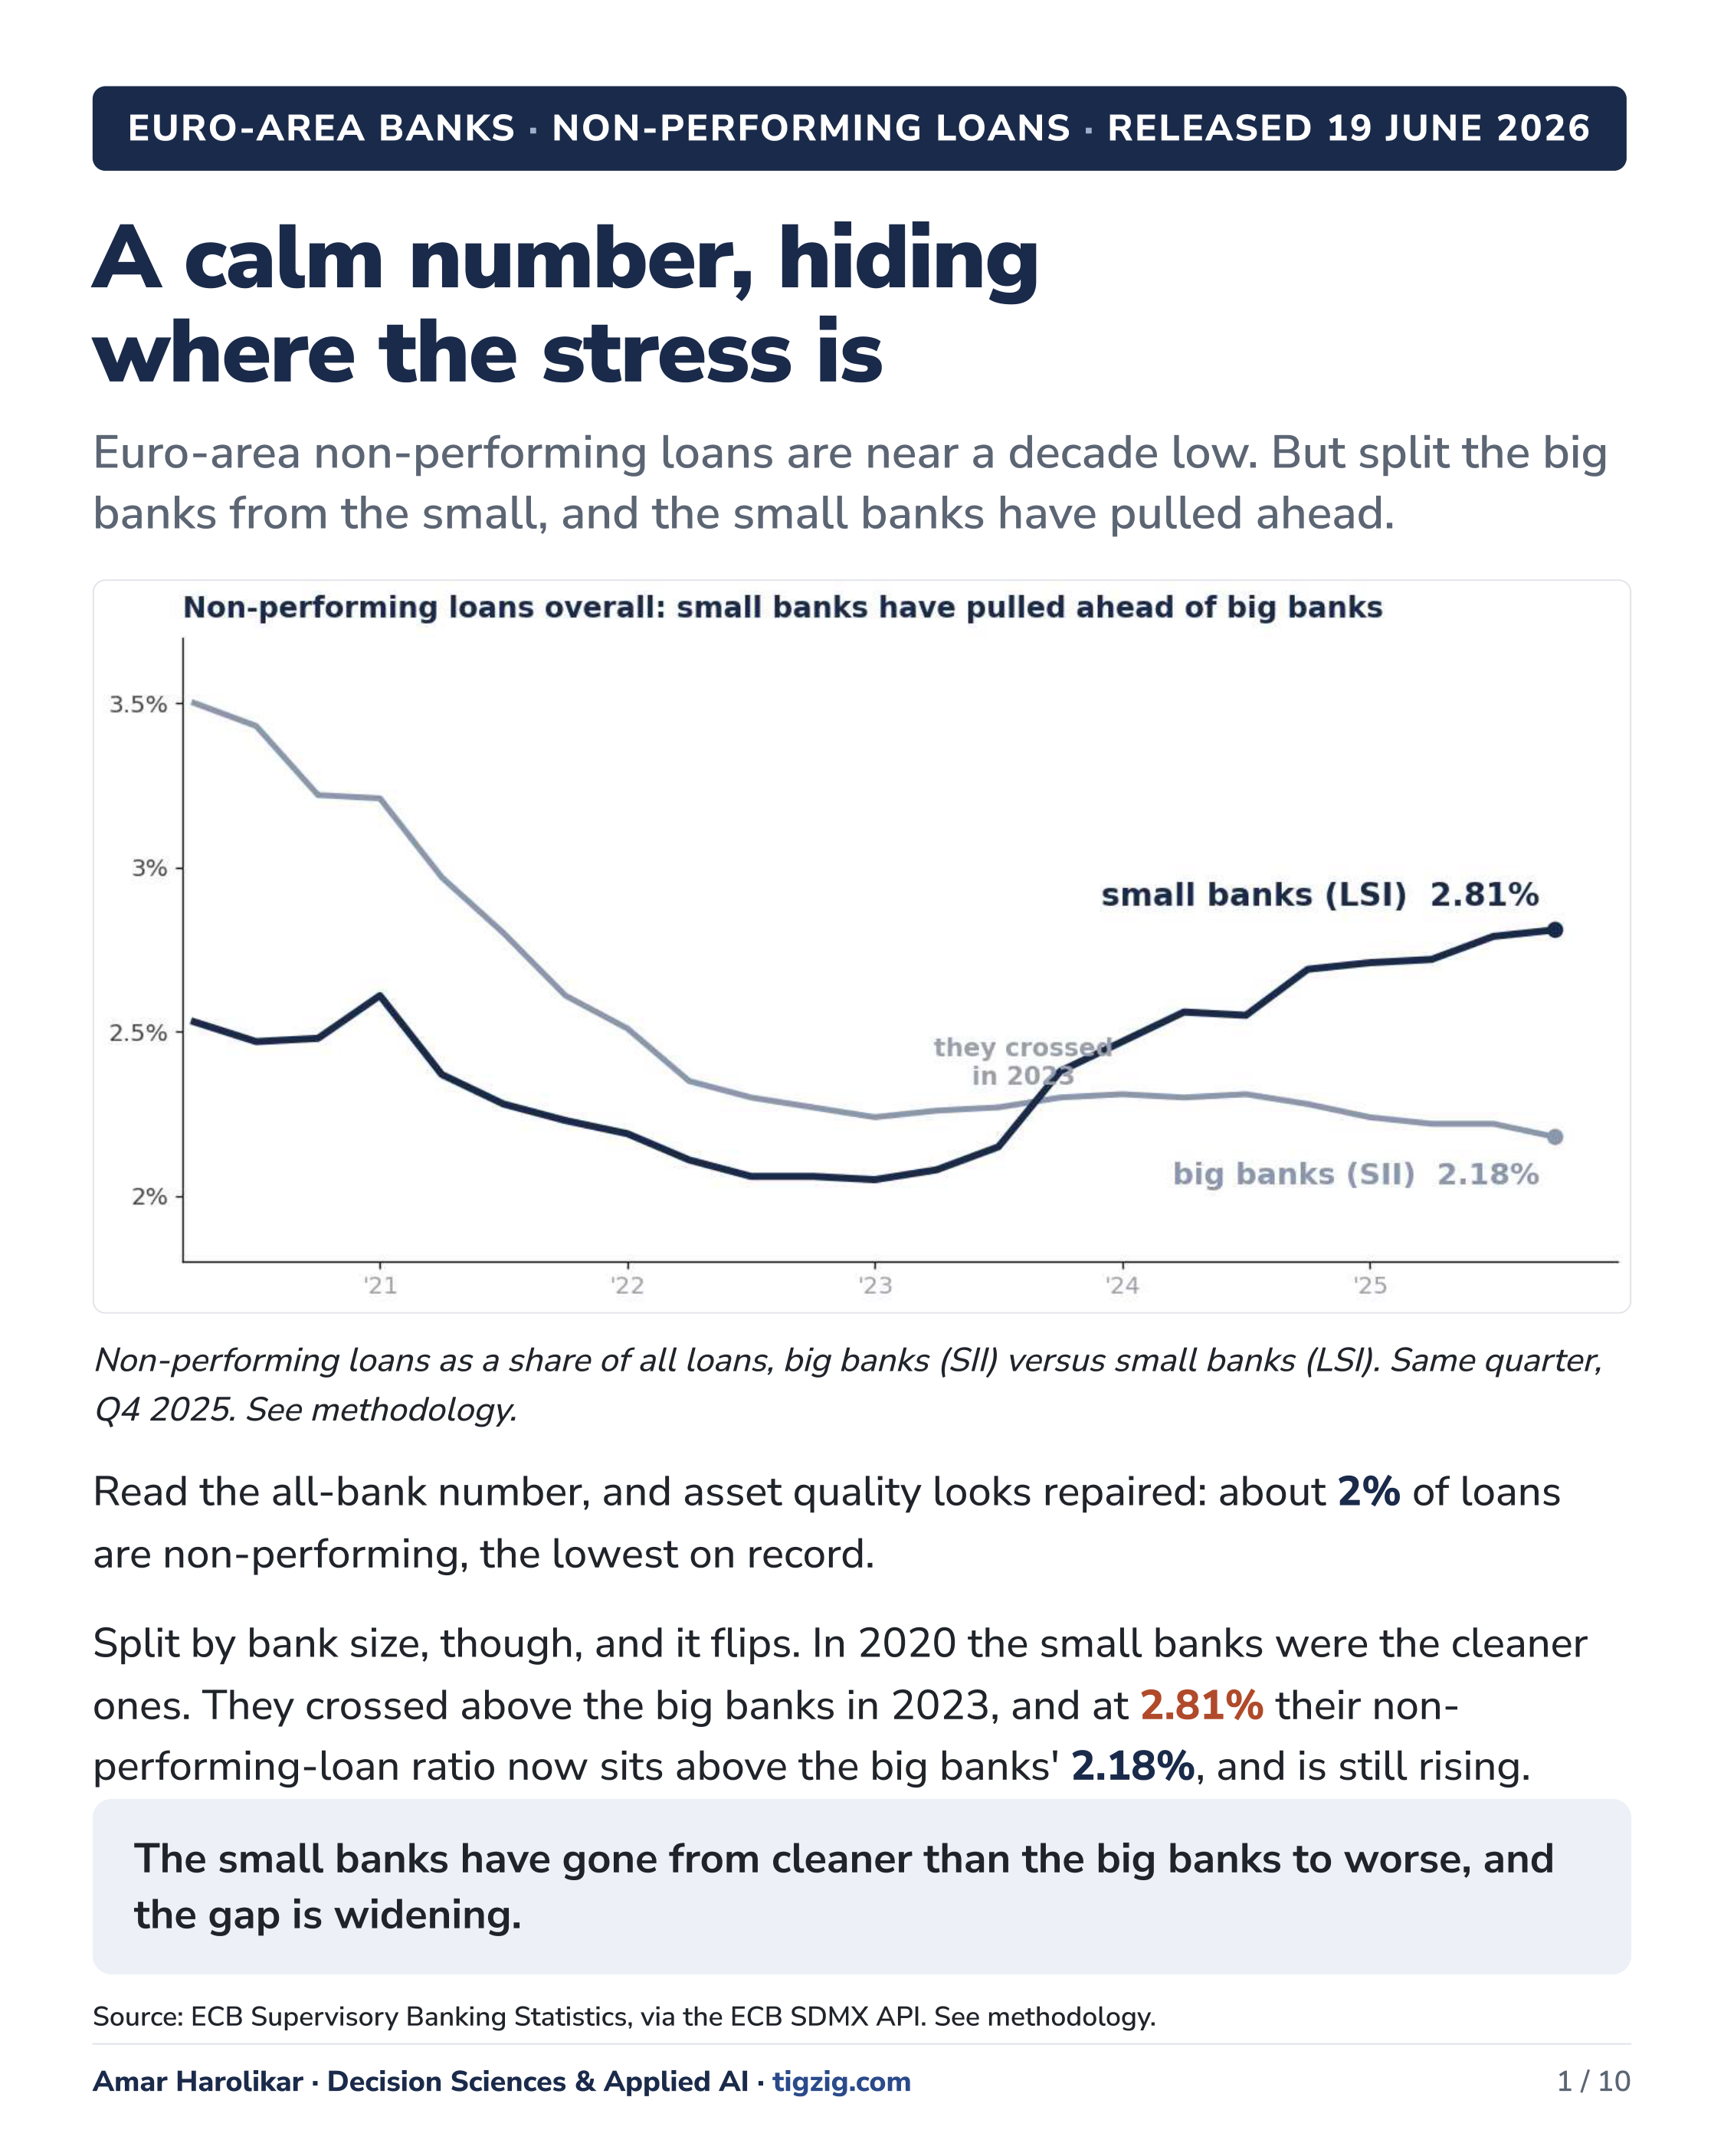
Euro-Area NPLs Look Calm. Split by Bank Size, the Small-Bank Corporate Book Is at 5.16% and Climbing.
Euro-area non-performing loans are near a decade low - but the calm headline hides where the stress is. Split by bank size and the small banks (less significant institutions, LSI - the Sparkassen, cooperative and savings banks; ~15% of euro-area bank assets) have pulled ahead of the big banks (significant institutions, SII, ~85% of assets). Big-bank NPLs sit near 2%; the small-bank corporate book has climbed to 5.16%, up about a third since 2023 and still rising. The consumer book is steady; the corporate book is the engine, and within that the two stressed corners are commercial real estate and small-business loans. Germany, Austria and Italy carry most of it - right where corporate insolvencies are running hot (Germany +57% vs the 2016-19 pre-pandemic May average per IWH; Austria 6,810 full-year 2025, +3.4%, property failures +35%; Italy ~+38% YoY per Allianz Trade). Households stay calm in the big systems (Germany 1.6% NPL, Netherlands 0.7%); the euro-area signal is corporate. Supervisors agree (ECB SREP 2025, OeNB FSR 51, ECB FSR May 2026) and tailored letters have gone to banks. Cycle to watch, not a system in trouble. 10-slide deck pulled live from the ECB SDMX REST API on 20 Jun 2026 (Q1 2026 release for SII / Q4 2025 for LSI - LSI lags one quarter by design, so SII vs LSI comparisons all use Q4 2025). Full 8-table copy-as-markdown dataset published at tigzig.com/ecb-npl-data-tables. Plus the parallel for the US: bank headline is also calm but the strain sits on the consumer (cards + autos) and in private credit, where losses hit the P&L directly and never show as a bank charge-off.
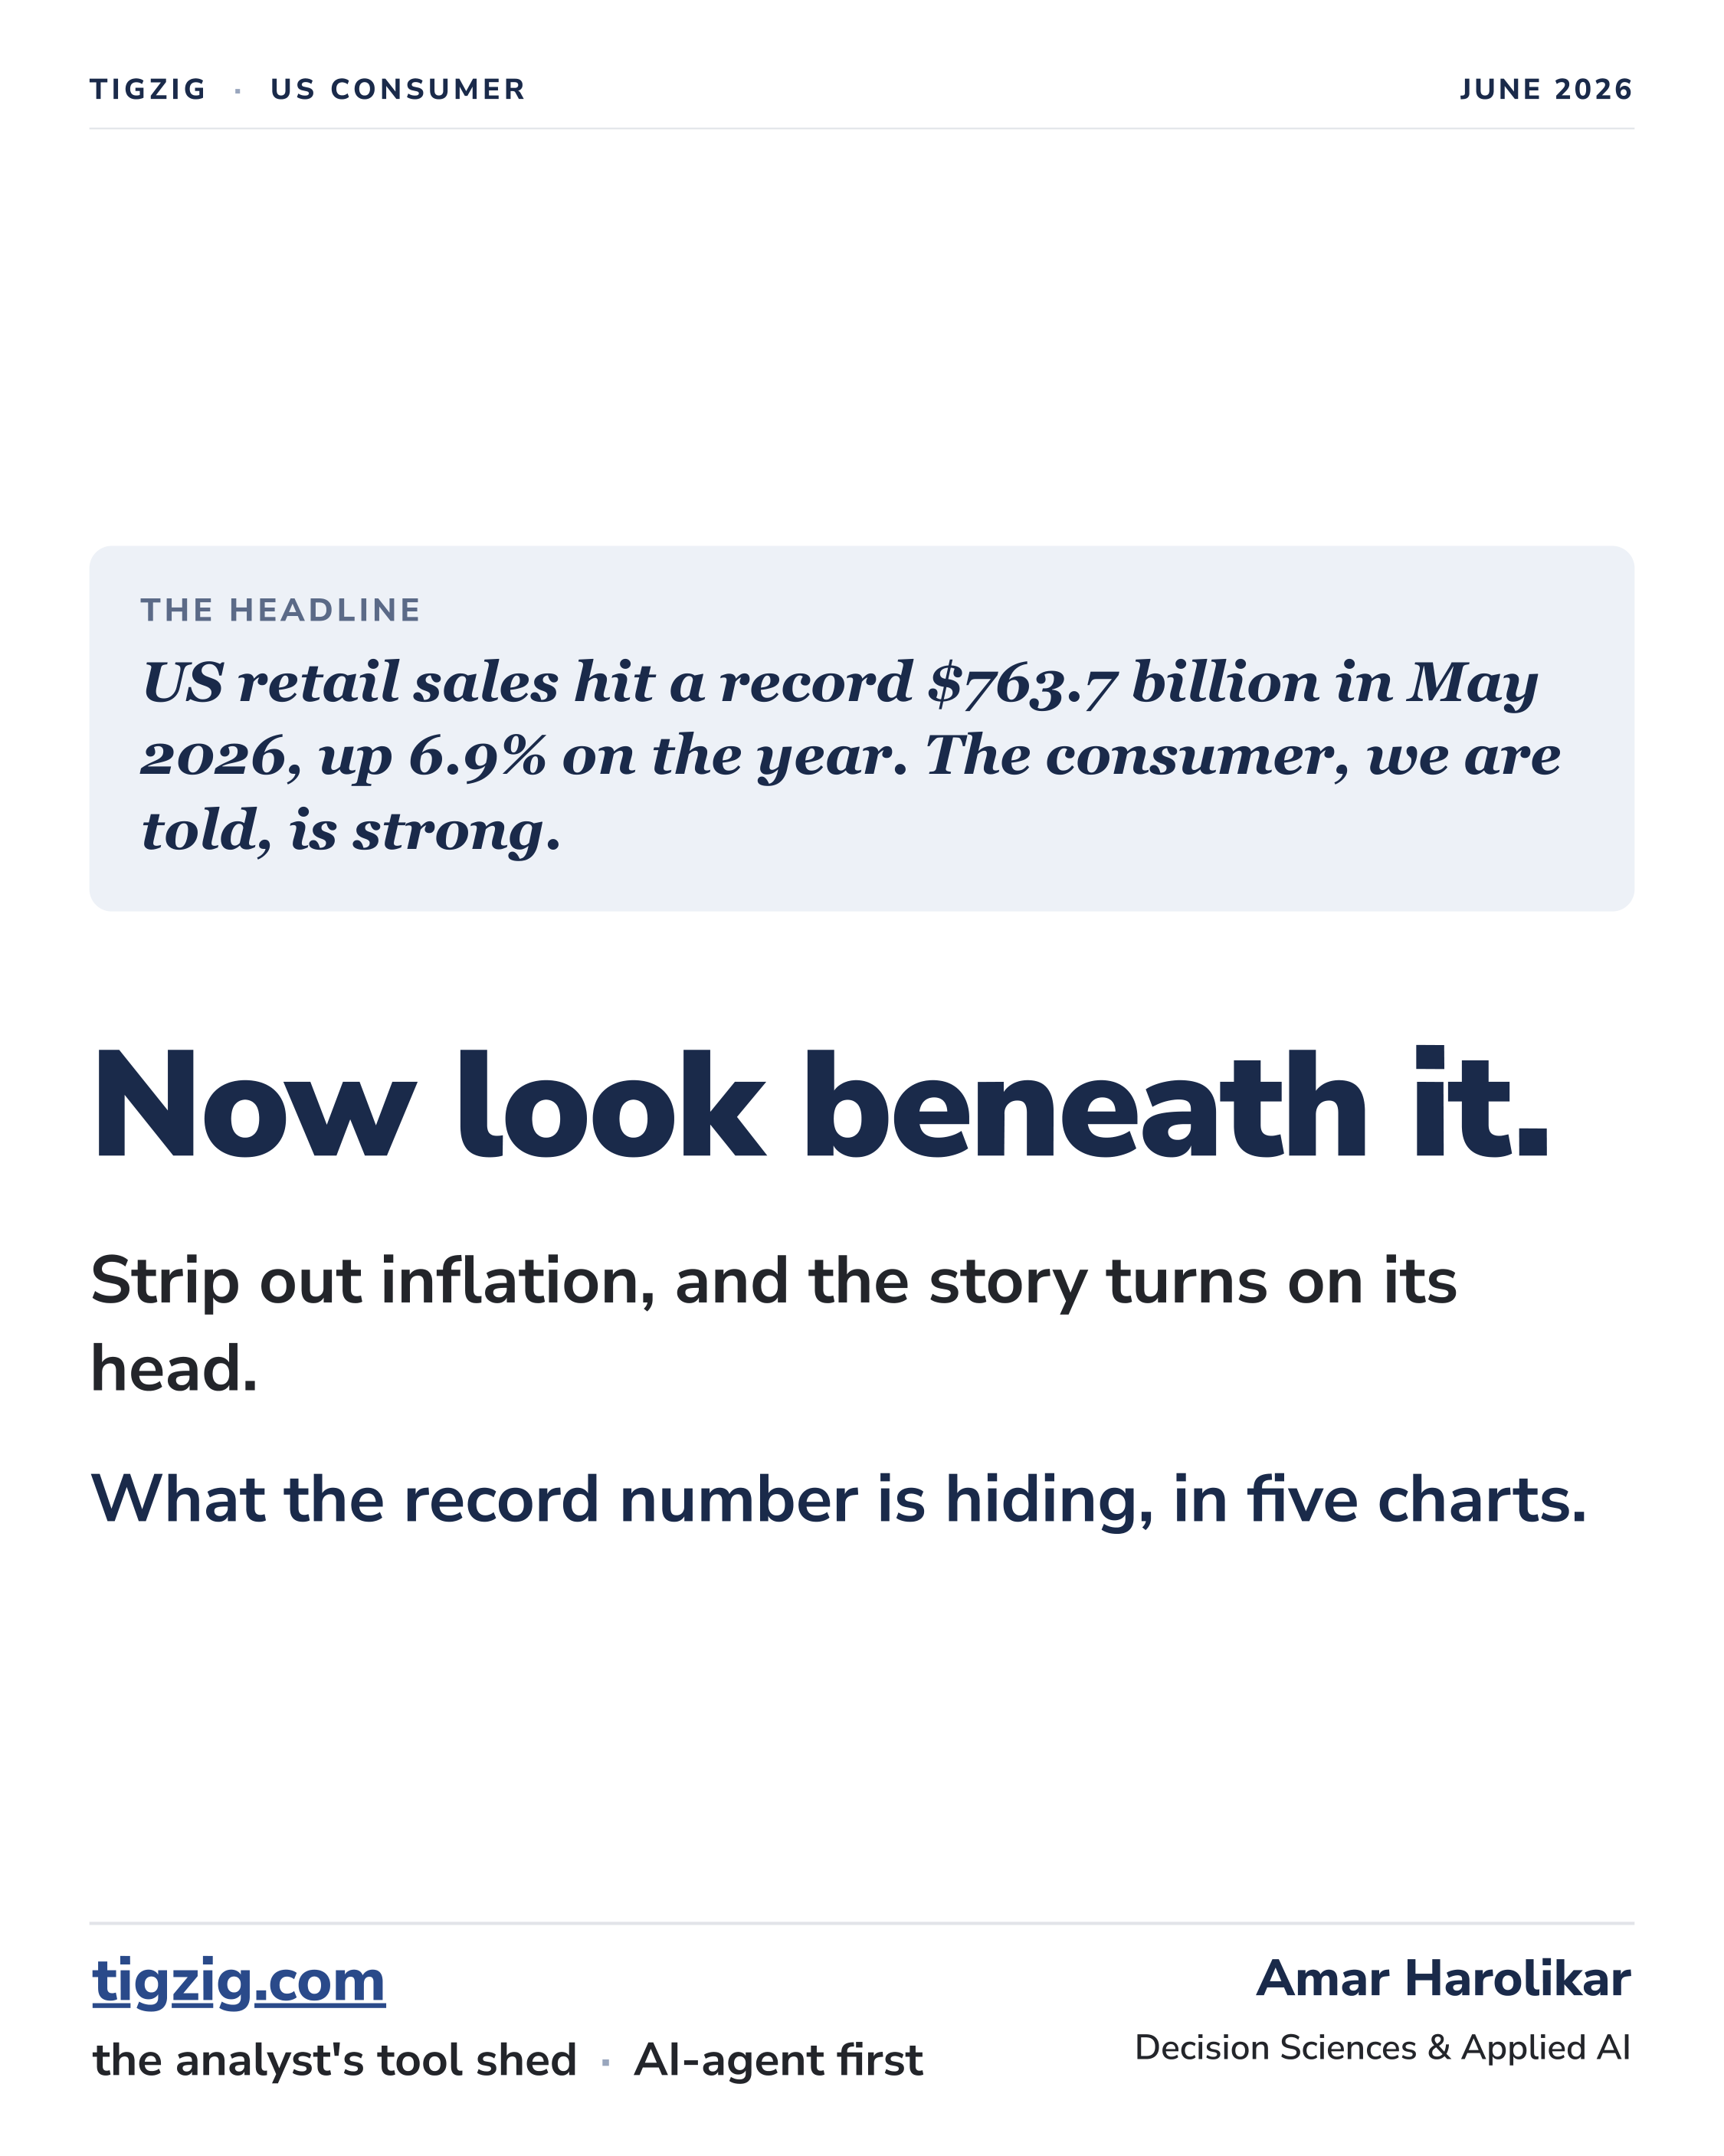
May 2026's Record US Retail Sales Number Is Hiding the Pain. Real Spending Hasn't Grown in Five Years. The Consumer Is Squeezed.
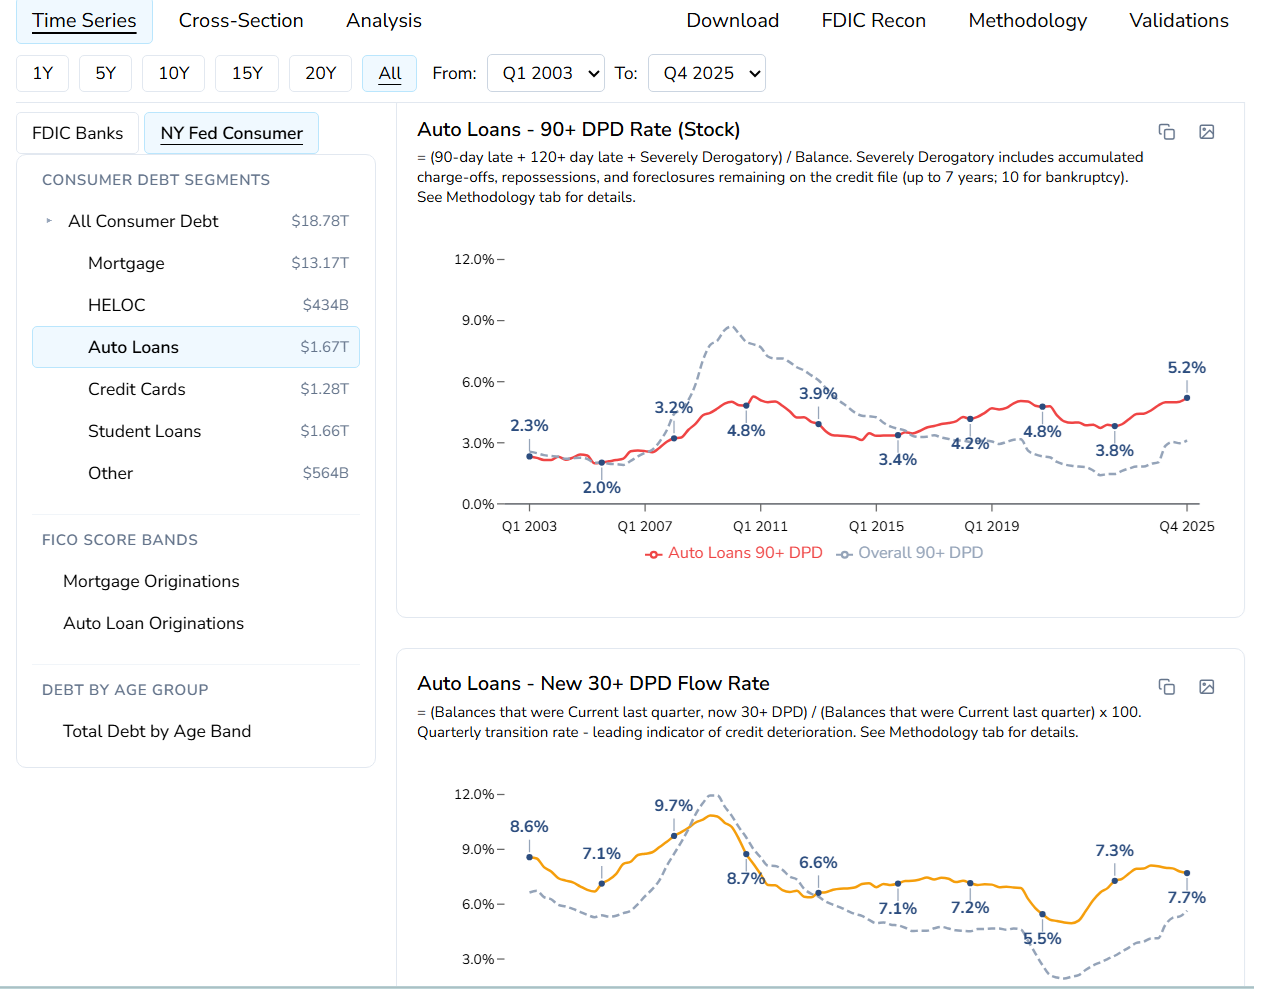
The May 2026 record US retail sales headline ($763.7bn, +6.9% YoY) is hiding the pain of a consumer being squeezed - and the squeeze was here long before the Iran war. Strip out inflation and real goods spending has not grown in five years: of the $763.7bn rung up in May 2026, only $605.9bn is real 2021 goods - the other $157.8bn is pure inflation. Households are holding the line by stretching: personal saving rate back to pre-2008 lows, NY Fed HELOC balances up 40% since 2021. The strain is starting to show: University of Michigan consumer sentiment collapsed to 44.8 (near the lowest on record), and 90+ day delinquencies on all consumer debt are back to 3.4% - past the 2007 mark. Real GDP still grows ~2% on services, AI investment and government, so this is a squeeze on the household goods budget, not an economy-wide downturn. The proof is the balance sheet: thinning savings, more borrowing, delinquencies past 2007. Companion piece: jobs market softening since 2024 (unemployment 4.3%, underemployment 8.1%, long-term joblessness near a 3-year high). Cheaper oil is real relief on the price side, but it does not refill a drained savings account or put the long-term unemployed back to work. 6-slide deck with every series live on tigzig.com -> Tremor (retail RSAFS + RRSFS, saving rate BEA, HELOC + delinquency NY Fed, sentiment U-Mich), pullable by API, Excel, or AI agent. Real retail definition: nominal Advance Retail & Food Services Sales deflated by headline CPI (the honest test of volume vs price).
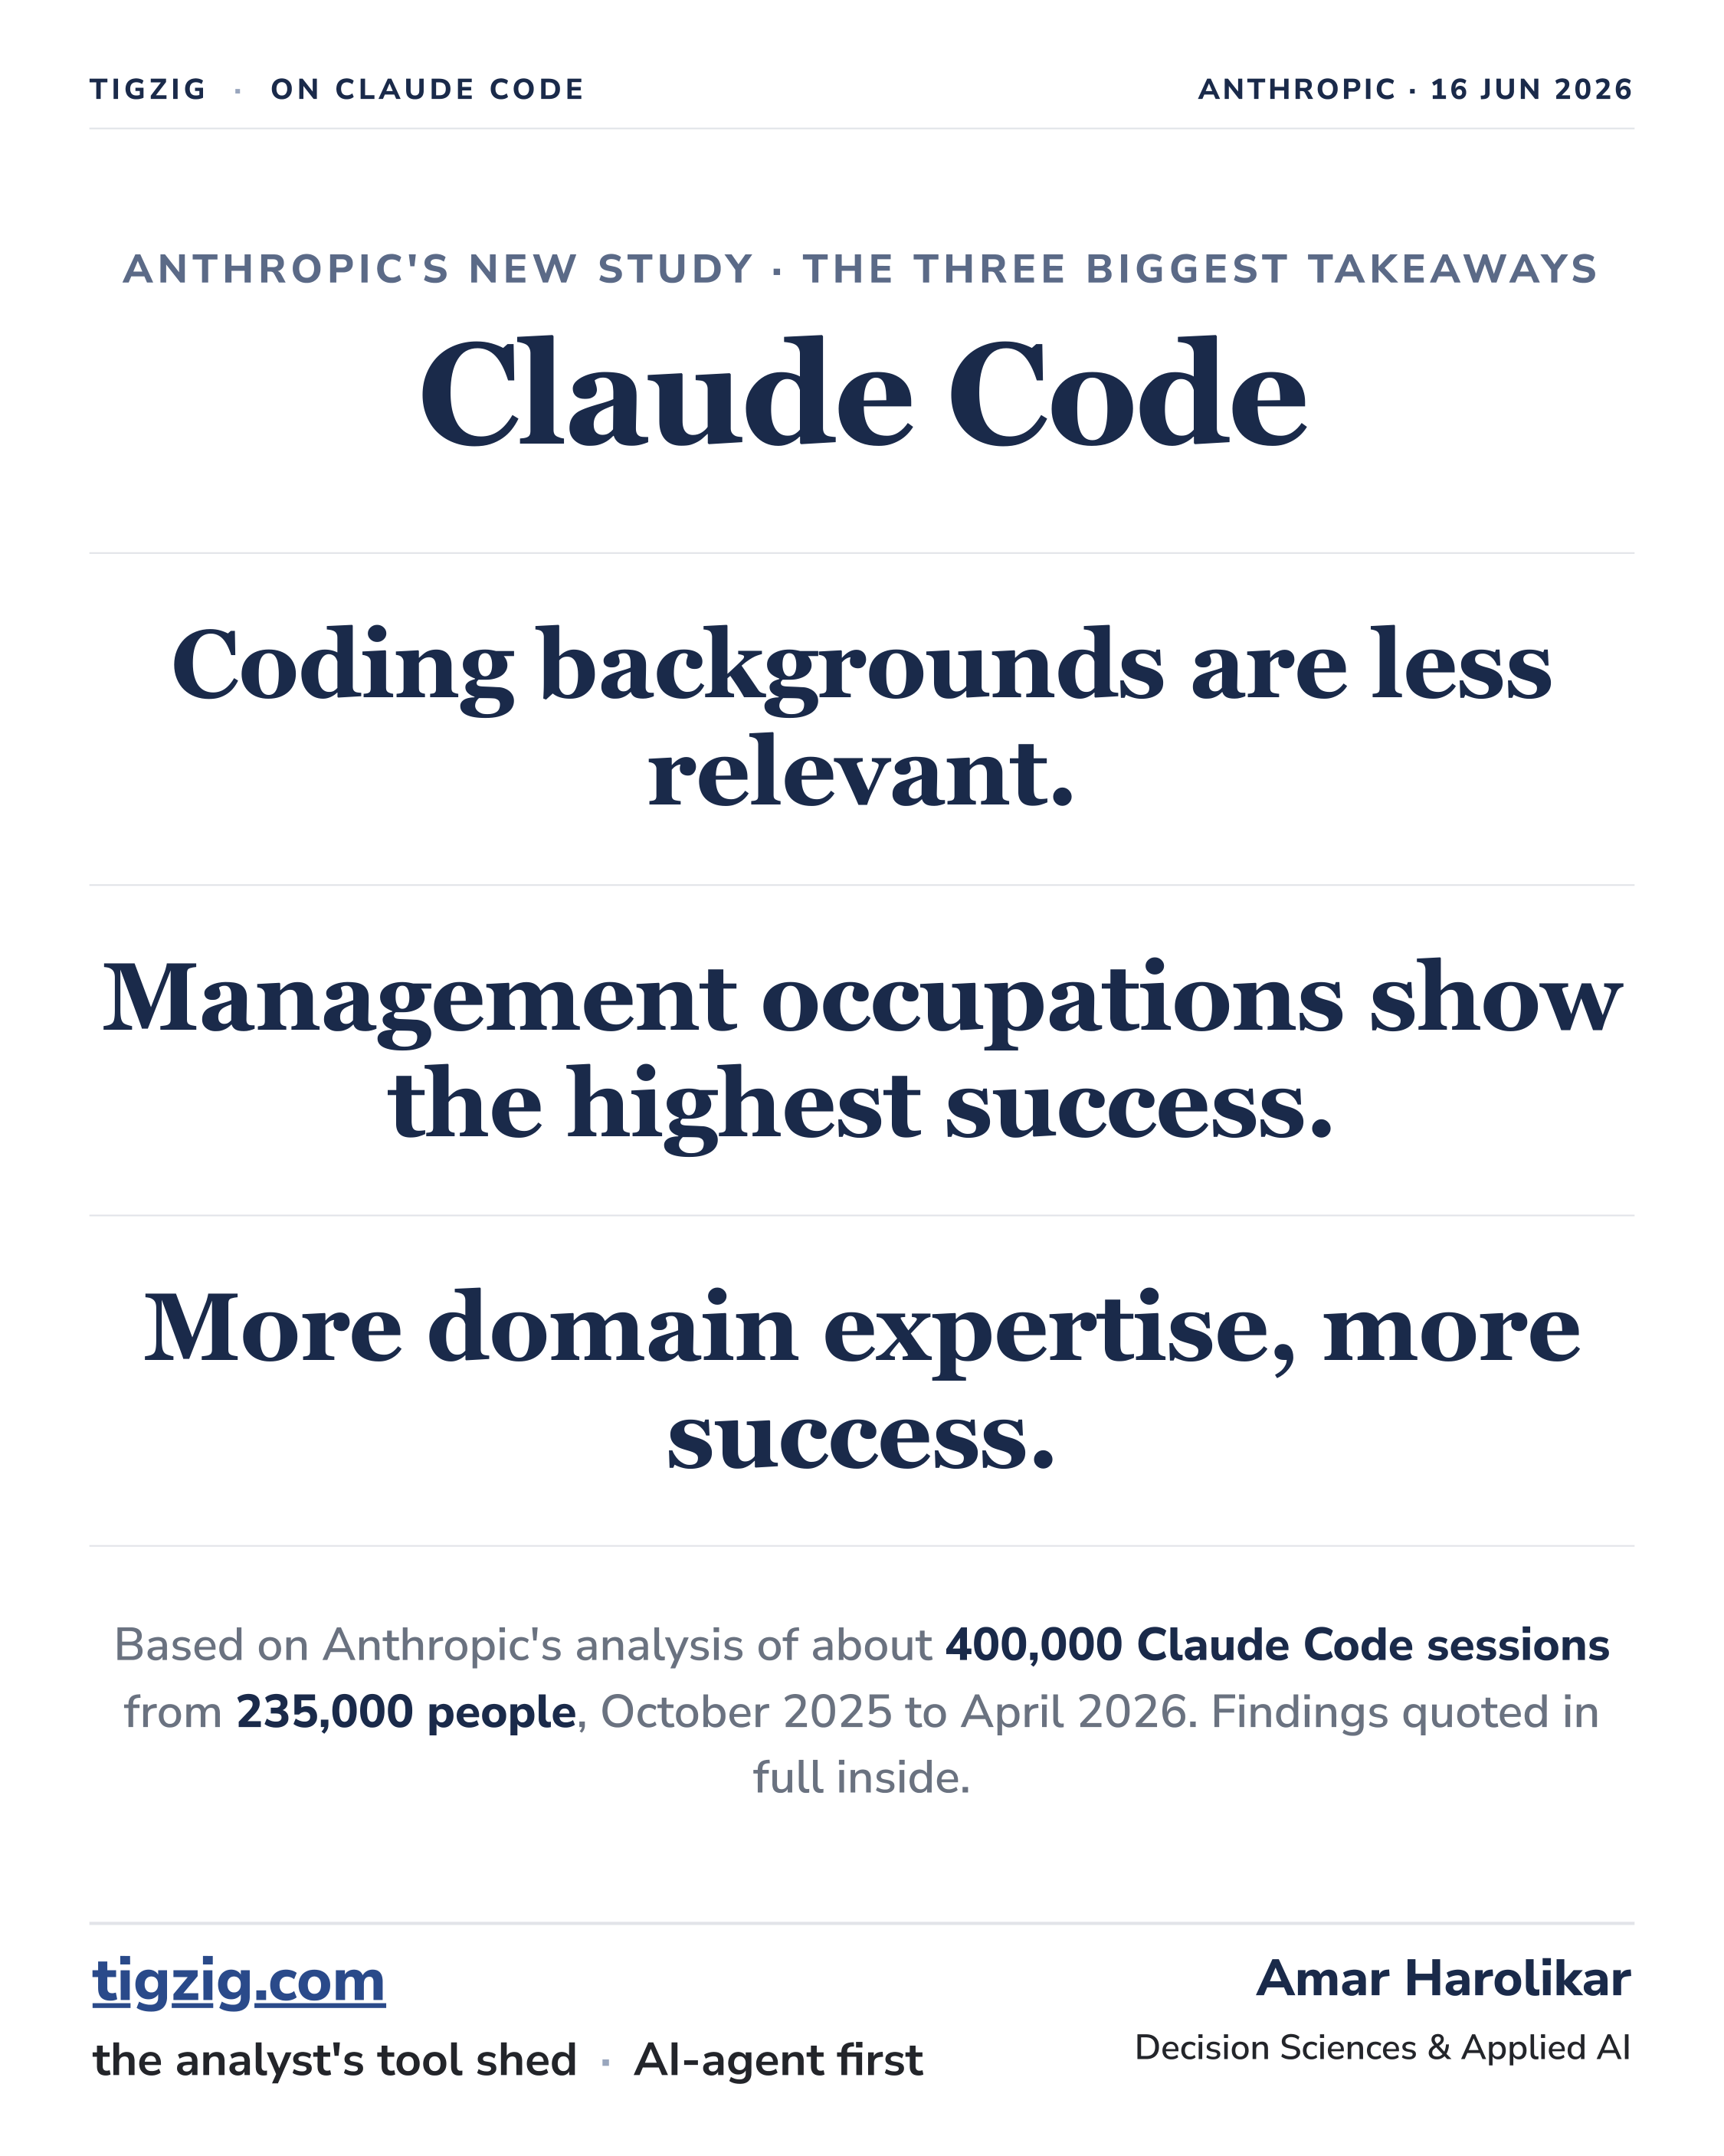
What Decides Whether a Coding Session Succeeds? Anthropic's New Study Says Domain Expertise, Not Coding Background.
Anthropic just published 'Agentic coding and persistent returns to expertise' - a privacy-preserving analysis of ~400,000 interactive Claude Code sessions from ~235,000 people, October 2025 to April 2026. Three takeaways pulled into a 9-slide summary deck with every headline a direct quotation: (1) coding background is becoming less relevant - every major occupation succeeds at rates within a few points of software-related occupations (software engineers verified at 34%; all ten largest groups within seven points); (2) management occupations show the highest verified success, slightly above software engineering, which Anthropic reads as management skills transferring to directing an agent (with a measurement caveat); (3) the more domain expertise a person brings, the more work Claude does per instruction (more than twice the actions, five times the output from the same prompt) and the more often the session ends in success (verified success doubles 15% to 33%, novice-to-intermediate is where most of the jump happens, and only 5-7% of expert sessions end abandoned vs 19% for novices). Bonus: the share of sessions spent fixing broken code fell from 33% to 19% while average task value rose 27% vs a freelance-market benchmark. Anthropic's honest caveat: classifiers remain challenging to validate at scale; they cannot measure whether the code is actually used. Matches the author's 25 years as an analyst - on coding the agents win by multiples, on deep domain the human still wins.
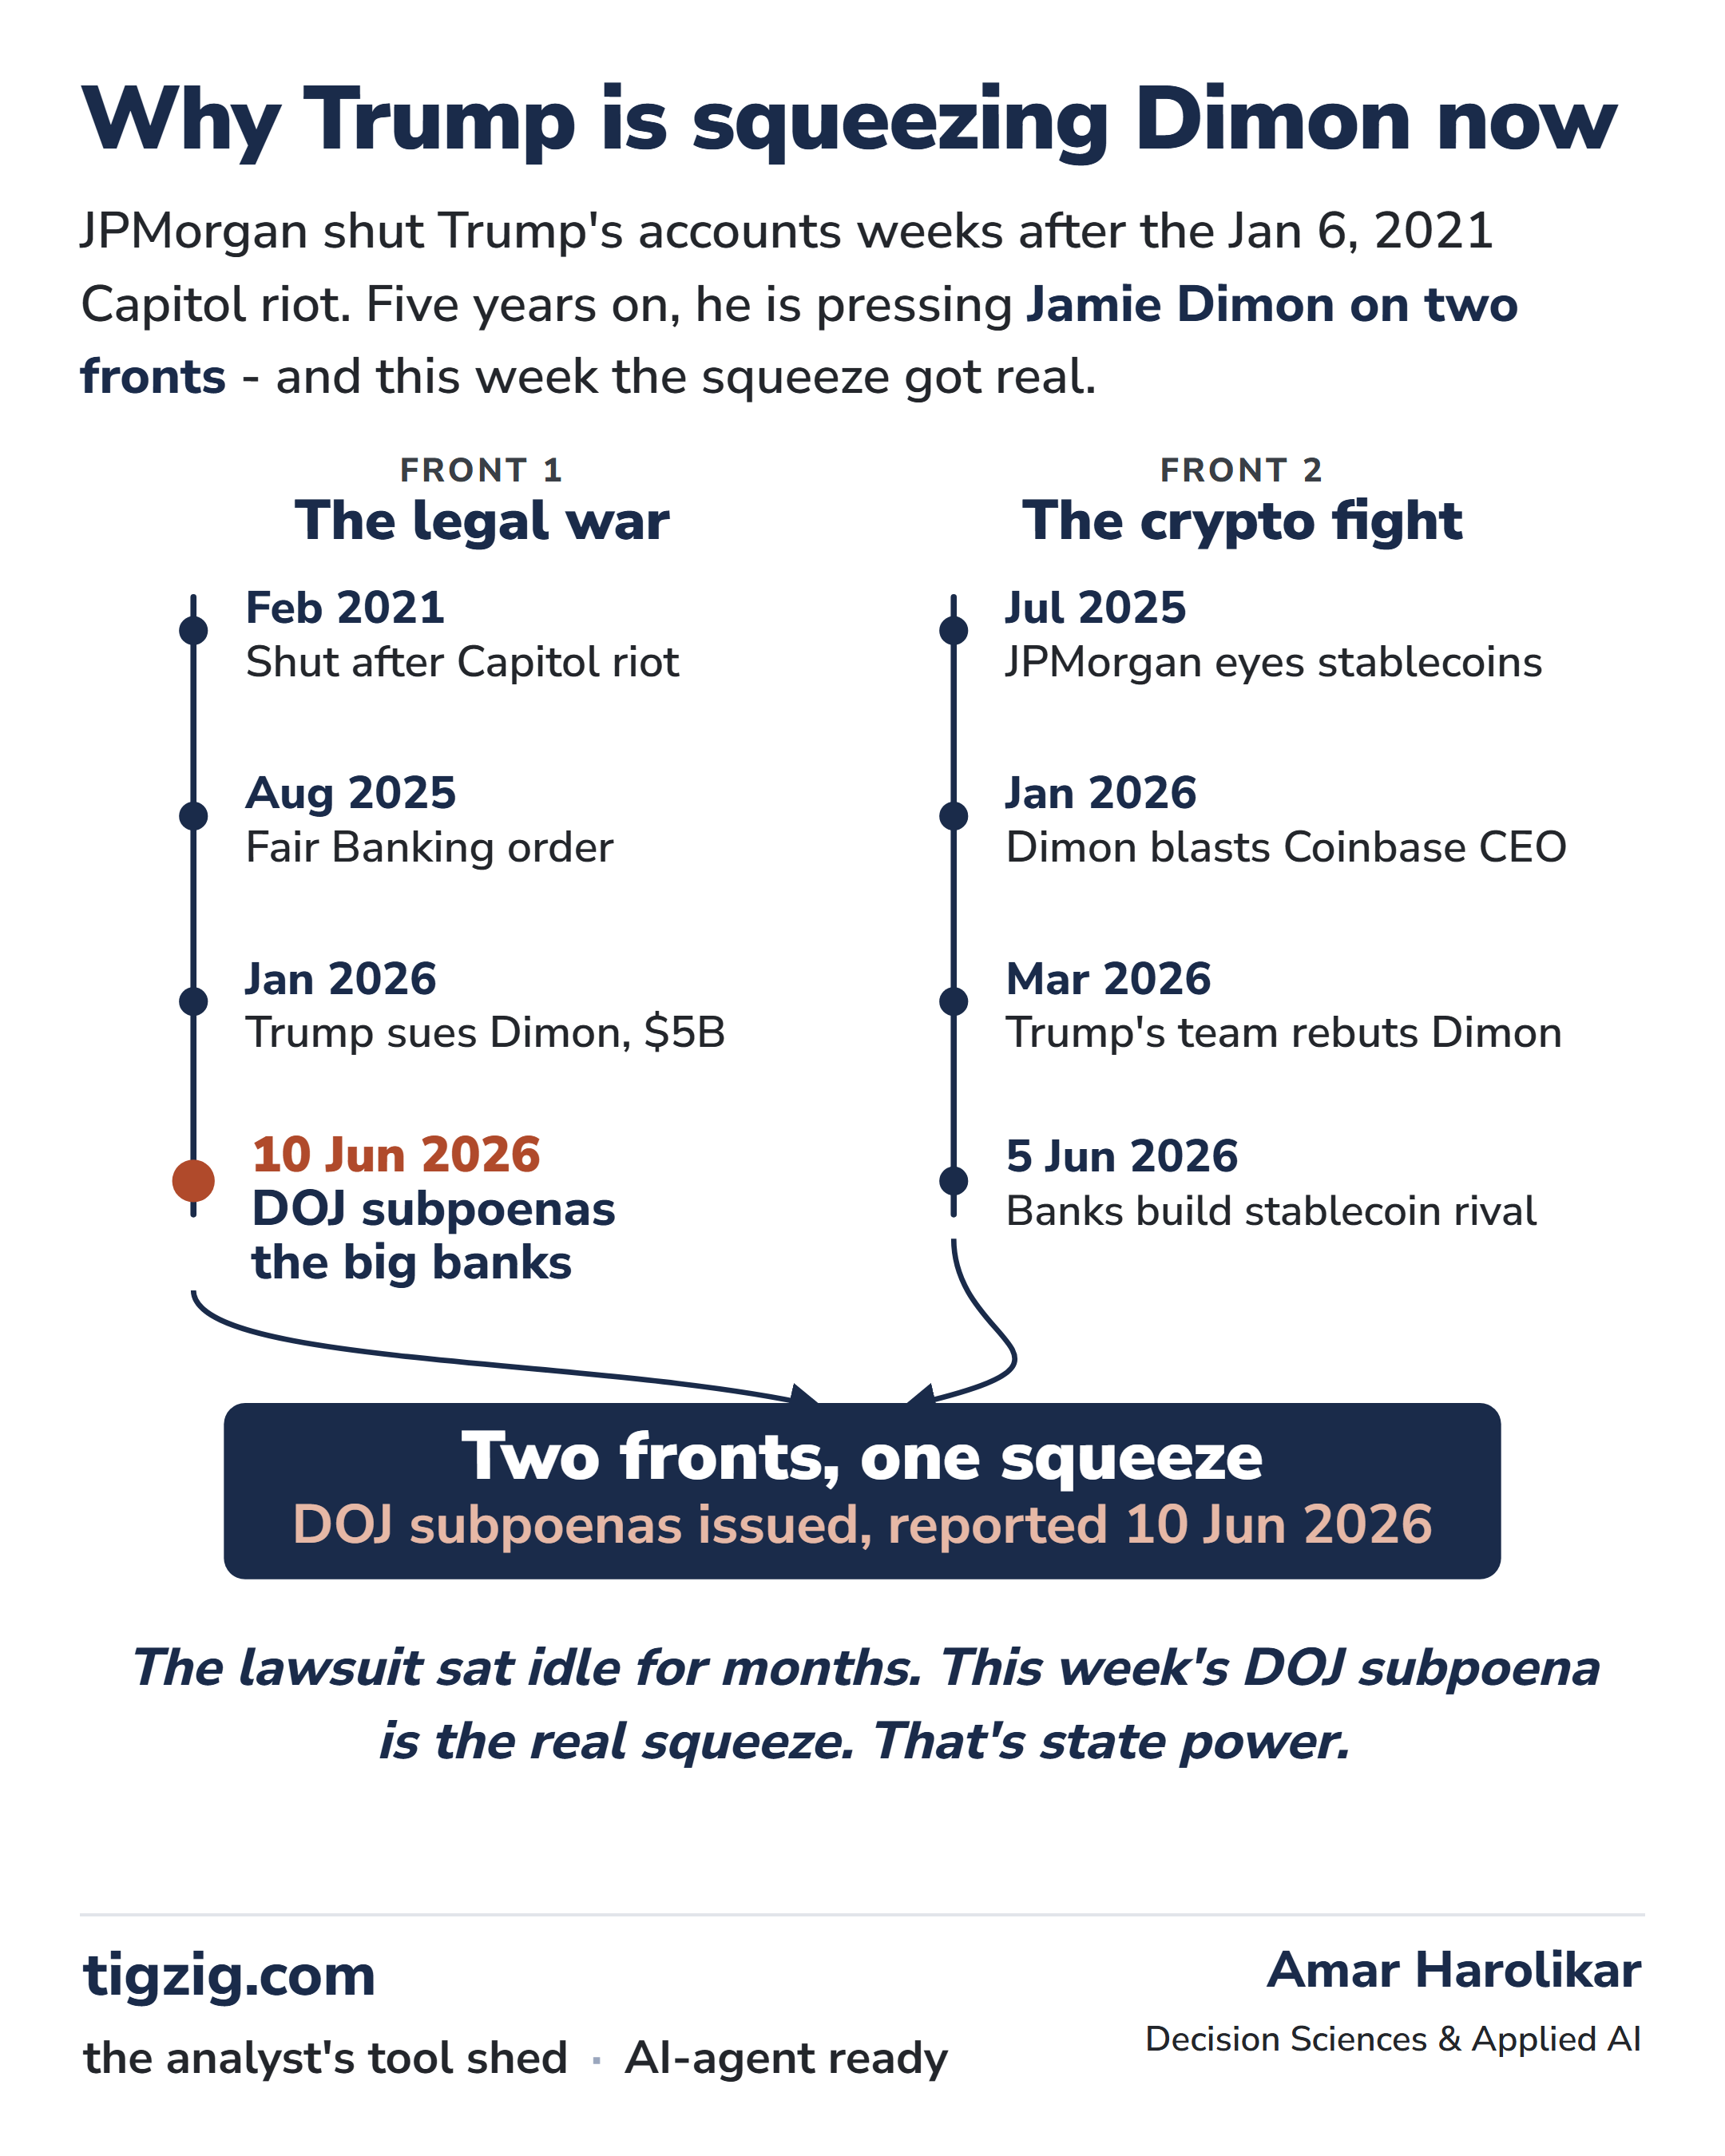
Why Trump Is Going After Jamie Dimon Right Now. Two Fronts - Debanking + Crypto. The DOJ Subpoena Made It Real.
Why is Trump going after Jamie Dimon right now, five years after JPMorgan shut his accounts weeks after Jan 6, and why this particular week? The legal war front: Feb 2021 debanking, Aug 2025 Fair Banking order, Jan 2026 Trump sues Dimon for $5 billion, and for months the lawsuit just sat there - lawyers filing papers, nothing moving. This week it got teeth: on 10 Jun 2026 the DOJ (through Jeanine Pirro's office) subpoenaed JPMorgan, Bank of America and Wells Fargo over the debanking. Private lawsuits limping along are one thing; the federal machinery moving in behind them is a different beast. Running alongside is the crypto fight - Trump signed the GENIUS Act last summer (the big stablecoin law) and wants the US to be 'the crypto capital of the world'; his family has crypto ventures of their own. Dimon has been the loudest bank voice fighting the next bill (CLARITY Act) and told the Coinbase CEO to his face he is full of it. Then on 5 Jun 2026 - days before the subpoenas landed - the big banks announced they are building their own blockchain money, a shared tokenized deposit network, so customer deposits stay locked in the regulated banking system and do not bleed out into the stablecoins Trump has been backing. Did the crypto fight cause the DOJ to move? No paper trail. But the incidents line up too close to wave away - read the motive for yourself.
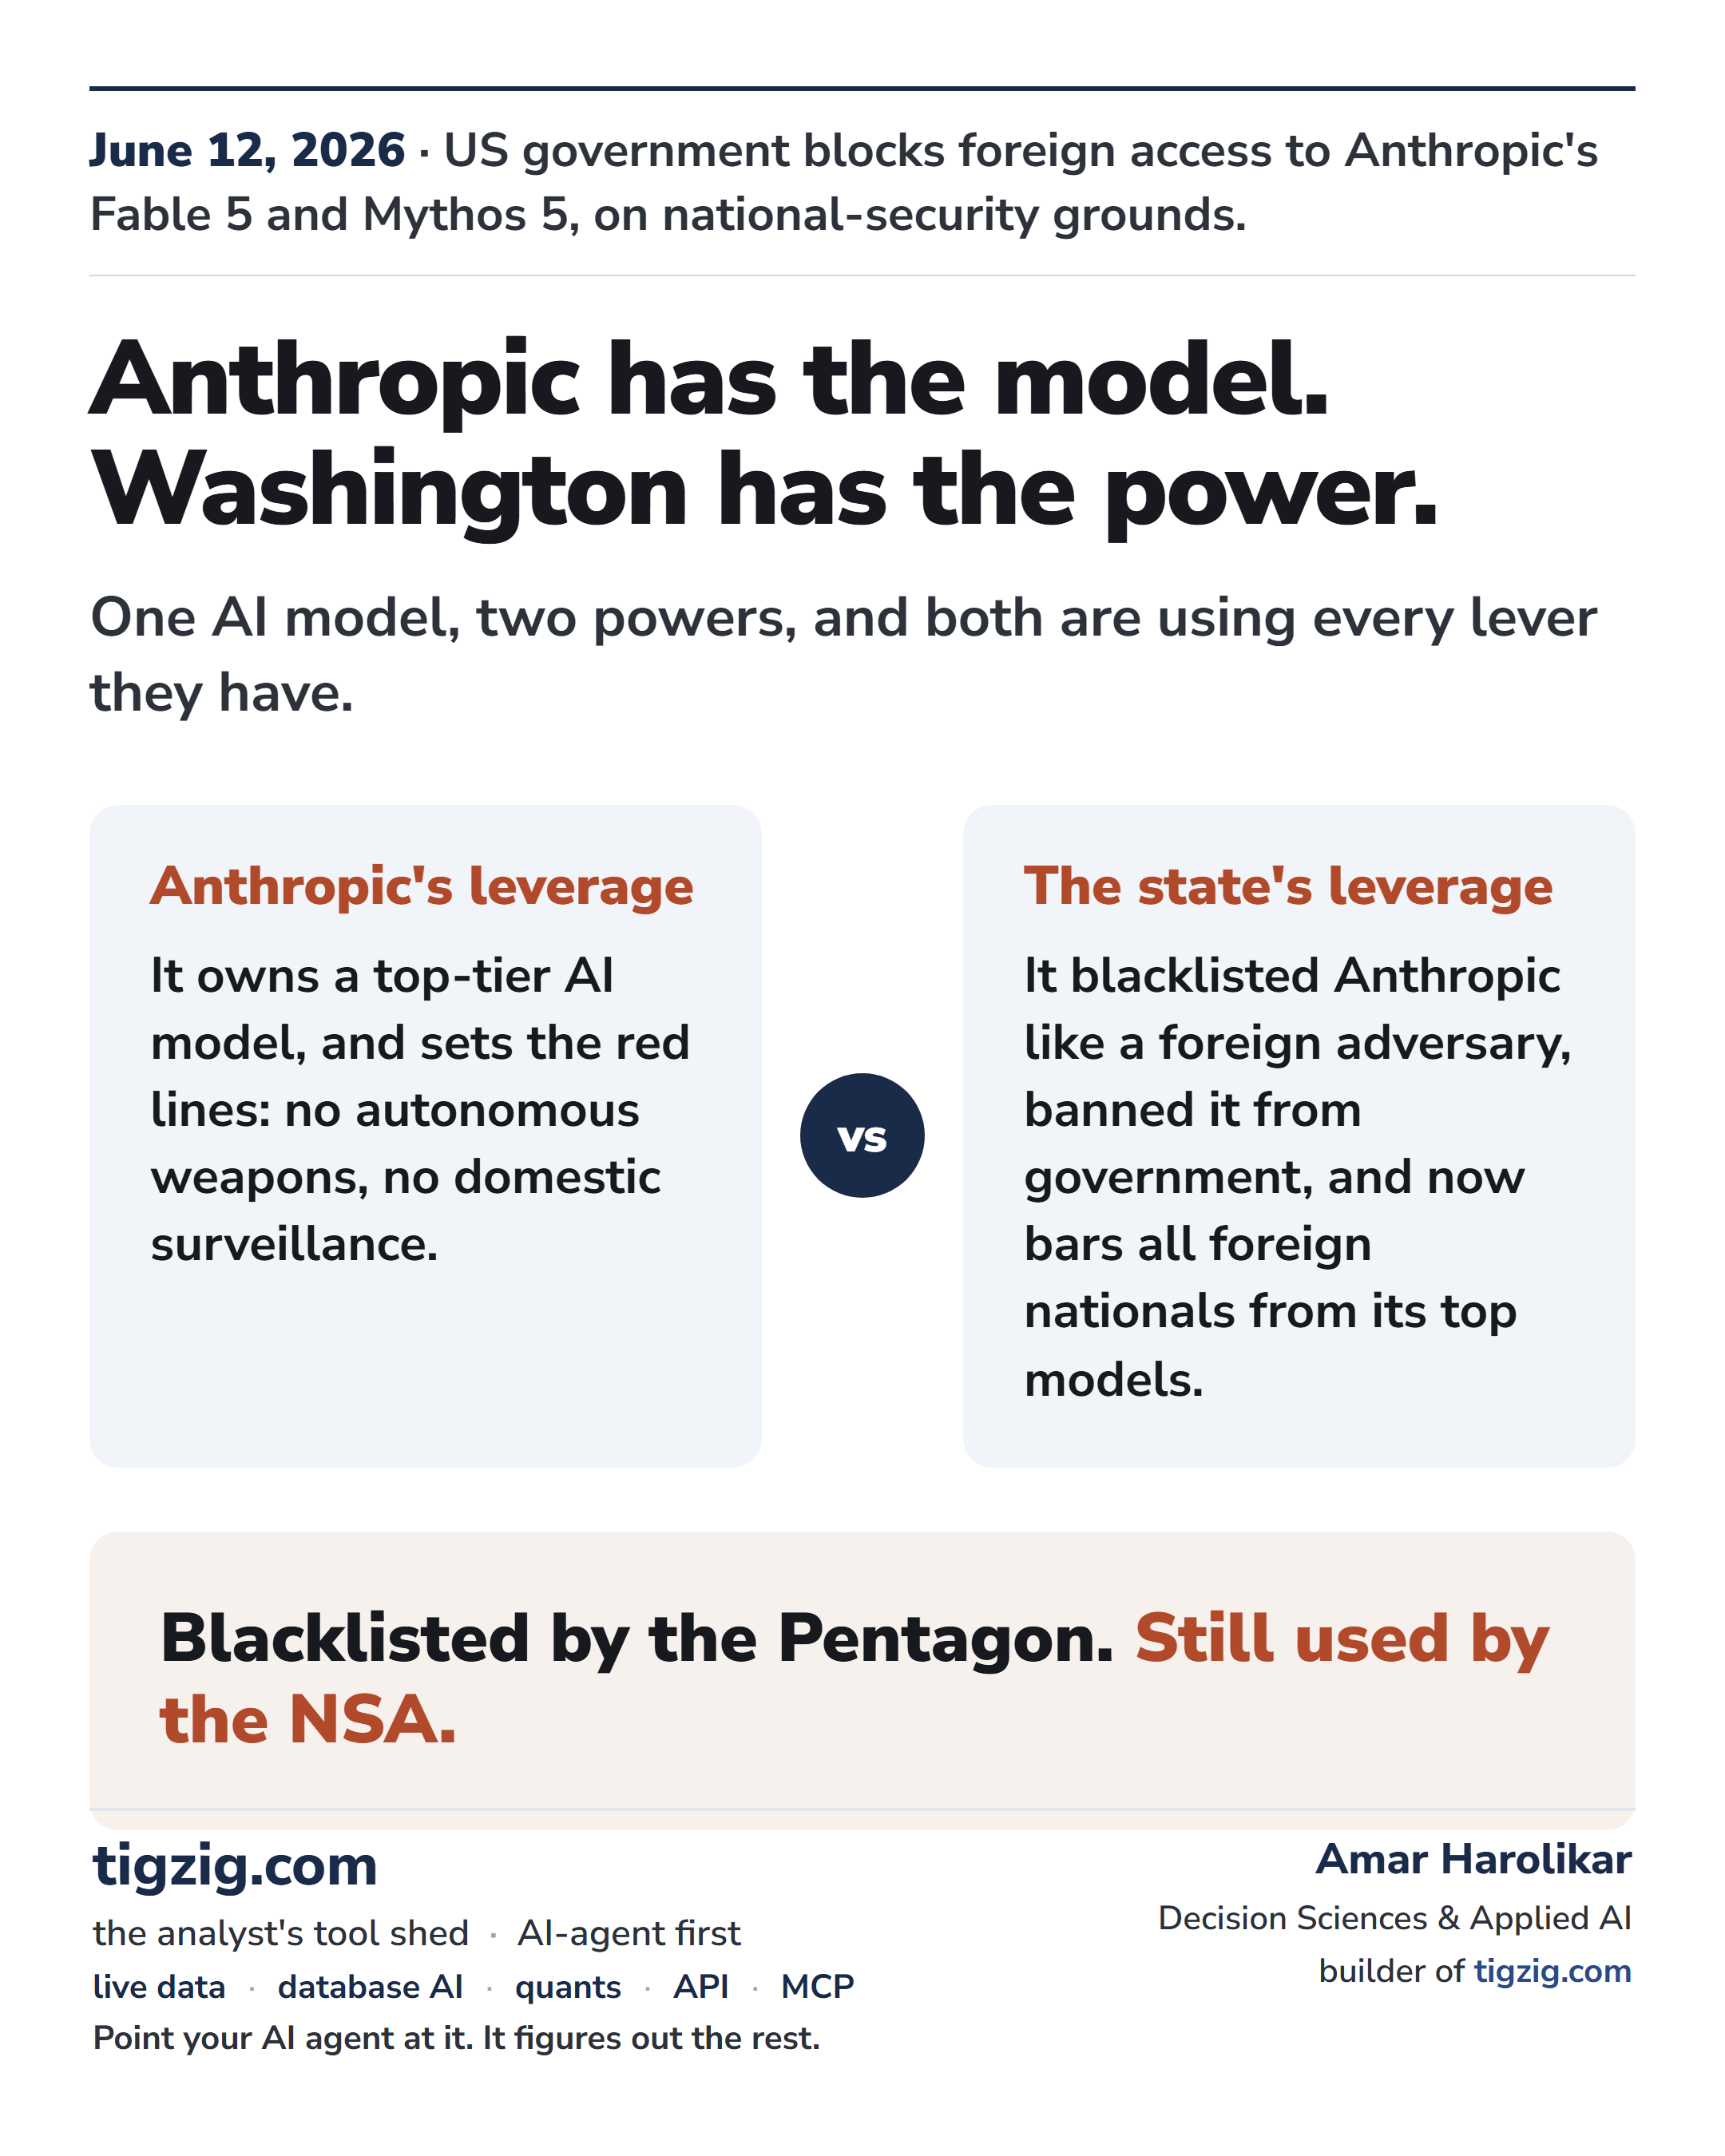
The Fable 5 Shutdown Isn't About a Jailbreak. It's the Anthropic vs US Government Standoff Coming to a Head.
This week's Fable 5 shutdown is not really about a jailbreak. It is the Anthropic vs US government standoff coming to a head. Months ago Anthropic refused to give the Pentagon 'all lawful use' of its models, holding two red lines - no fully autonomous weapons, no domestic surveillance. Trump ordered every federal agency to stop using Anthropic, and the Pentagon branded it a 'supply chain risk', a label normally reserved for foreign adversaries - the first American company to get it. The defense work went to OpenAI. A federal judge called the blacklisting 'classic illegal First Amendment retaliation' and 'Orwellian', but an appeals court let the blacklist stand while the case runs. Meanwhile the NSA - under the same Pentagon - is reported (per Axios) to be using Anthropic's most powerful model anyway: too dangerous to allow, too useful to drop. This week Commerce blocked all foreign nationals from Fable 5 and Mythos 5 over a jailbreak Anthropic says is minor and doable on other models. To comply, Anthropic switched both models off worldwide. The irony: the Pentagon's whole fear was that Anthropic could pull the plug on its own model. This week, Anthropic pulled the plug. A standoff between a company that draws red lines on its own tech and a state that treats frontier AI as too strategic to leave to a company. The company has the model. The government has the machinery.
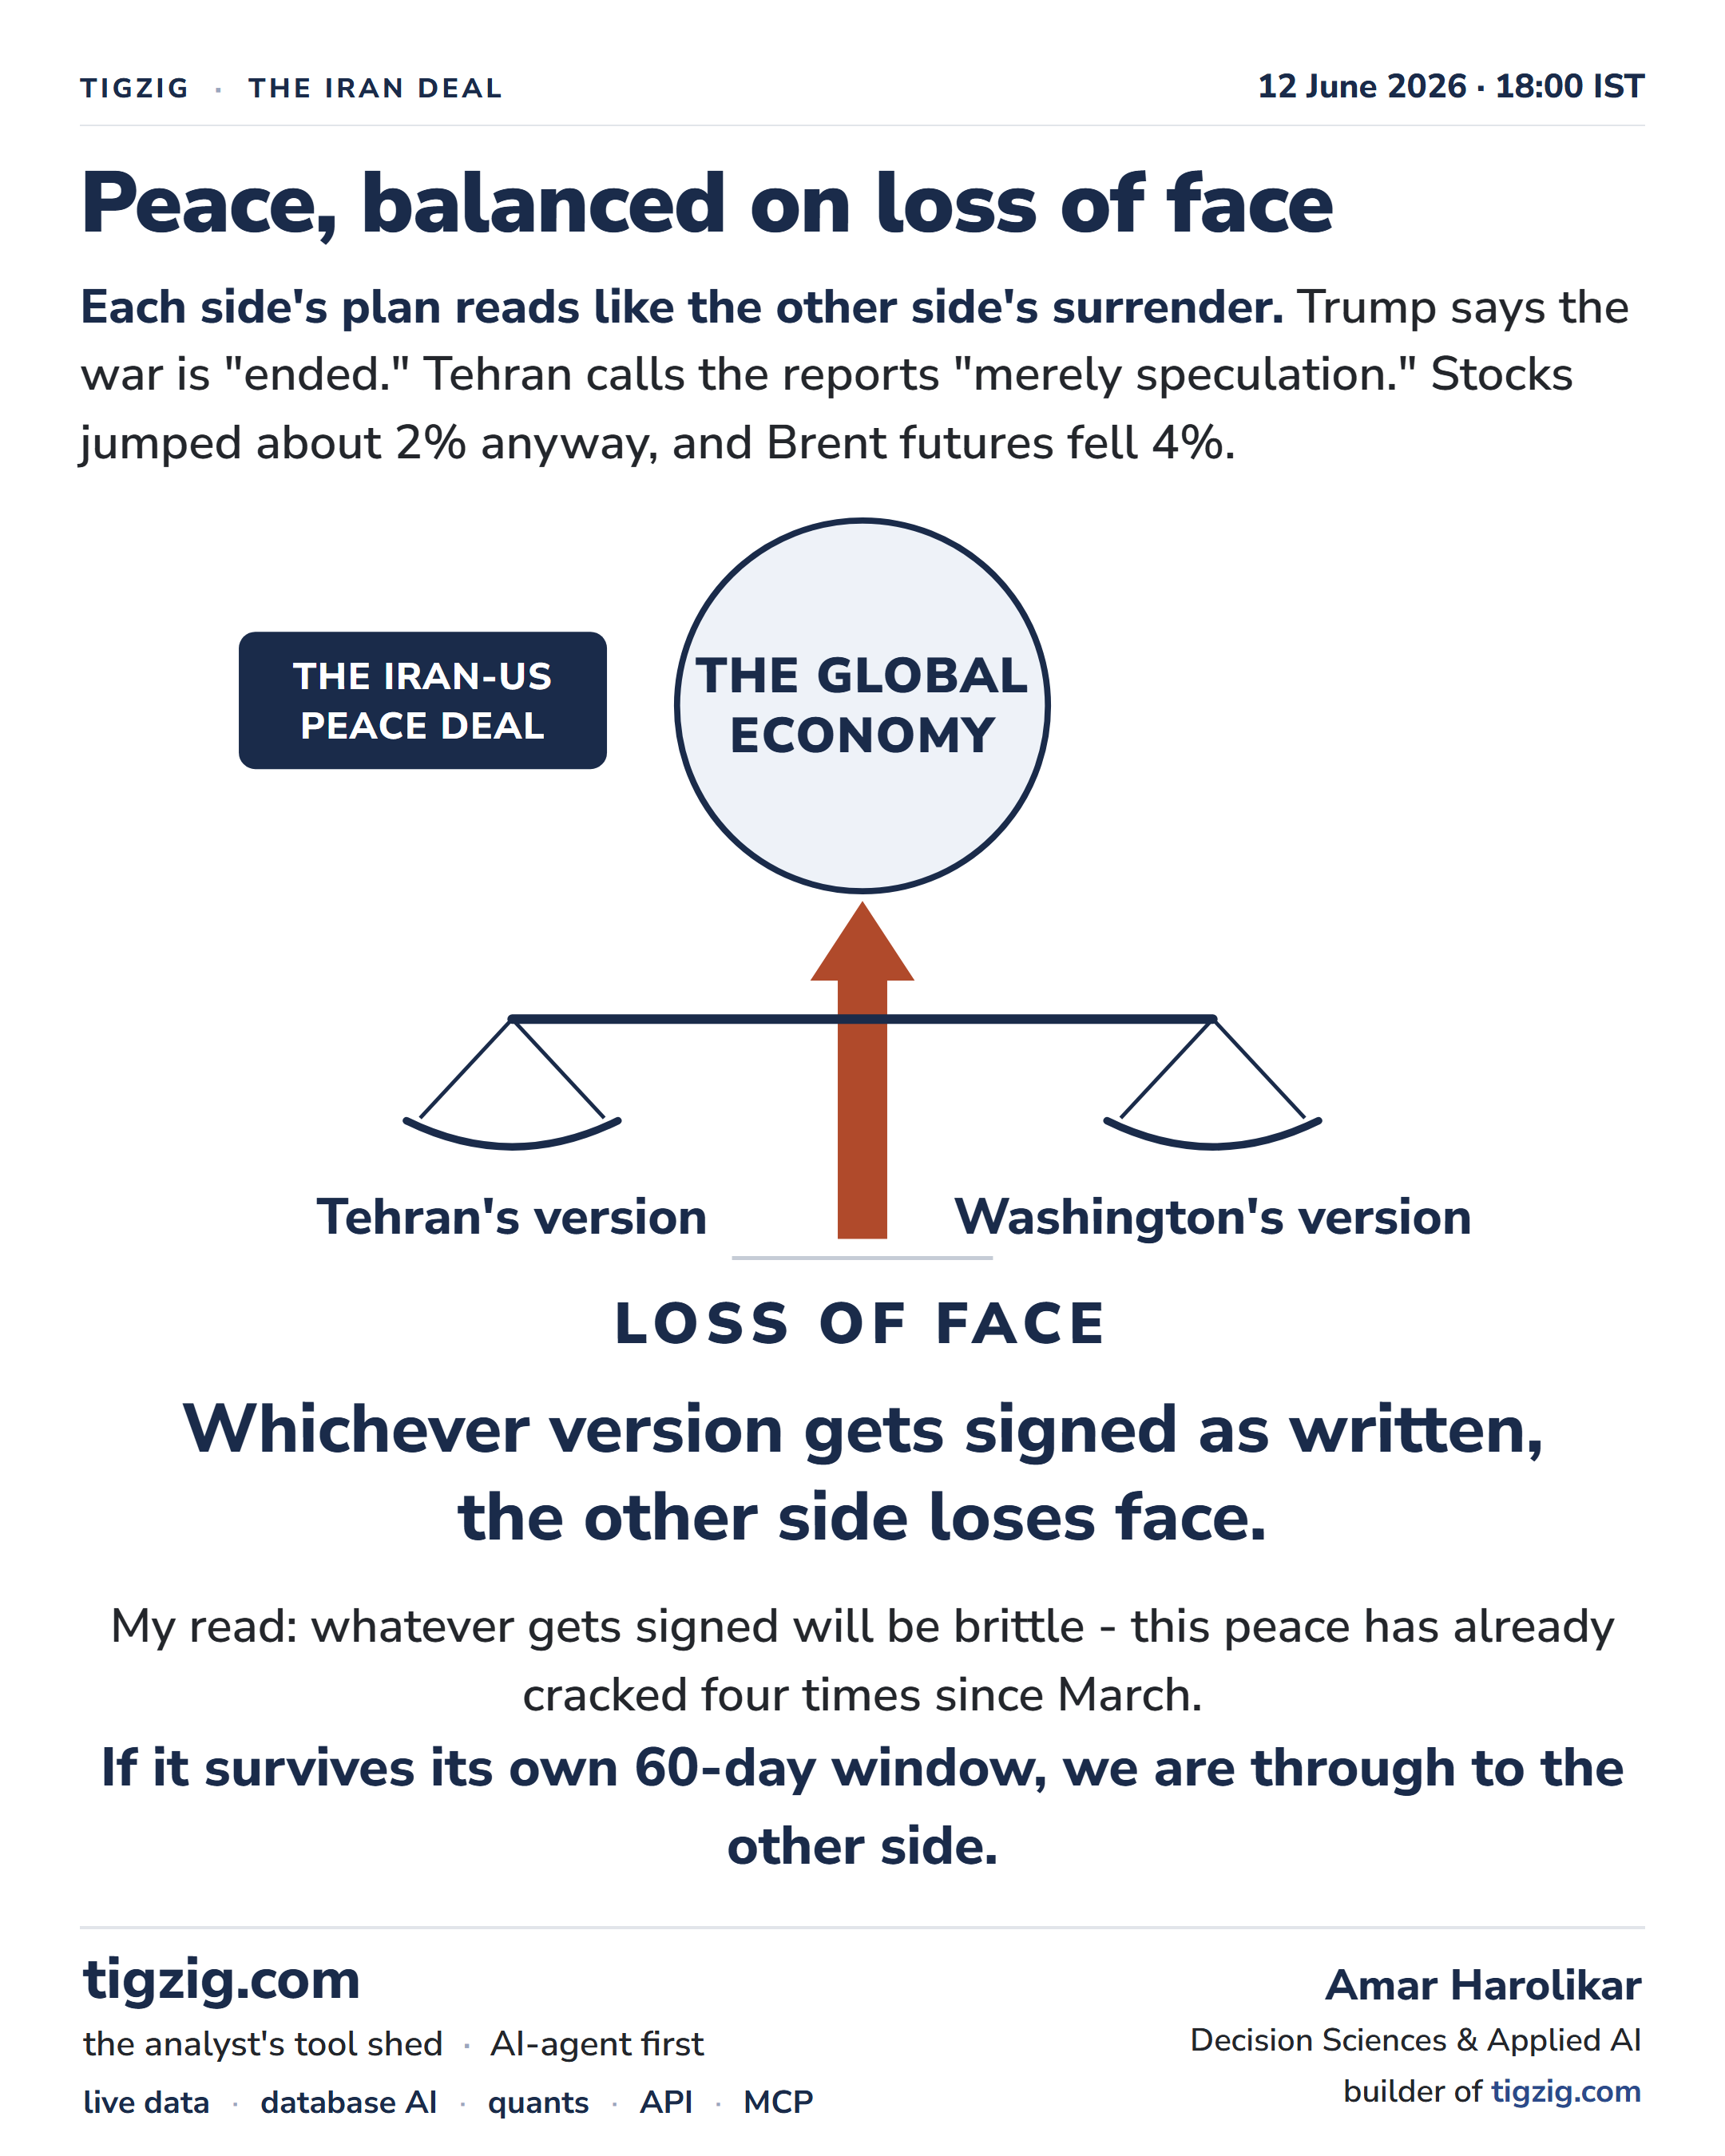
Markets Are Celebrating an Iran Deal. Nobody Has Agreed Which Deal. Peace Is Balanced on Loss of Face.
Markets are celebrating an Iran deal, but nobody has agreed which deal. Trump says the war is 'ended'; Tehran calls the reports 'merely speculation' and says there is no final decision yet. CNN counts ~40 times Trump has called a deal imminent. ~100 days into the war the macro damage is real: UK GDP at -0.1% in April (released today), US gasoline $4.65, stressed US consumer, global economy showing cracks. Two drafts in circulation, and they look almost nothing alike. Tehran's 14-point version (leaked to Iranian state media, picked up by CNBC): ceasefire on all fronts, naval blockade lifted, Hormuz reopened on Iran's arrangements, oil sanctions suspended, $12bn unfrozen before talks even begin, $300bn reconstruction plans, US forces out, missiles and proxies off the agenda - and the nuclear negotiation only after all of that, with a 60-day window. Washington's version (via diplomat to CNN): Hormuz reopened immediately with no Iranian fees, sanctions relief with no set date, deal 'satisfies all US requirements on the nuclear issue.' Each side's plan reads like the other side's surrender. Stocks jumped ~2%; Brent futures fell 4%. Whichever version gets signed as written, the other side loses face. My read: whatever gets signed will be brittle - this peace has already cracked four times since March. If it survives its own 60-day window, we are through to the other side.
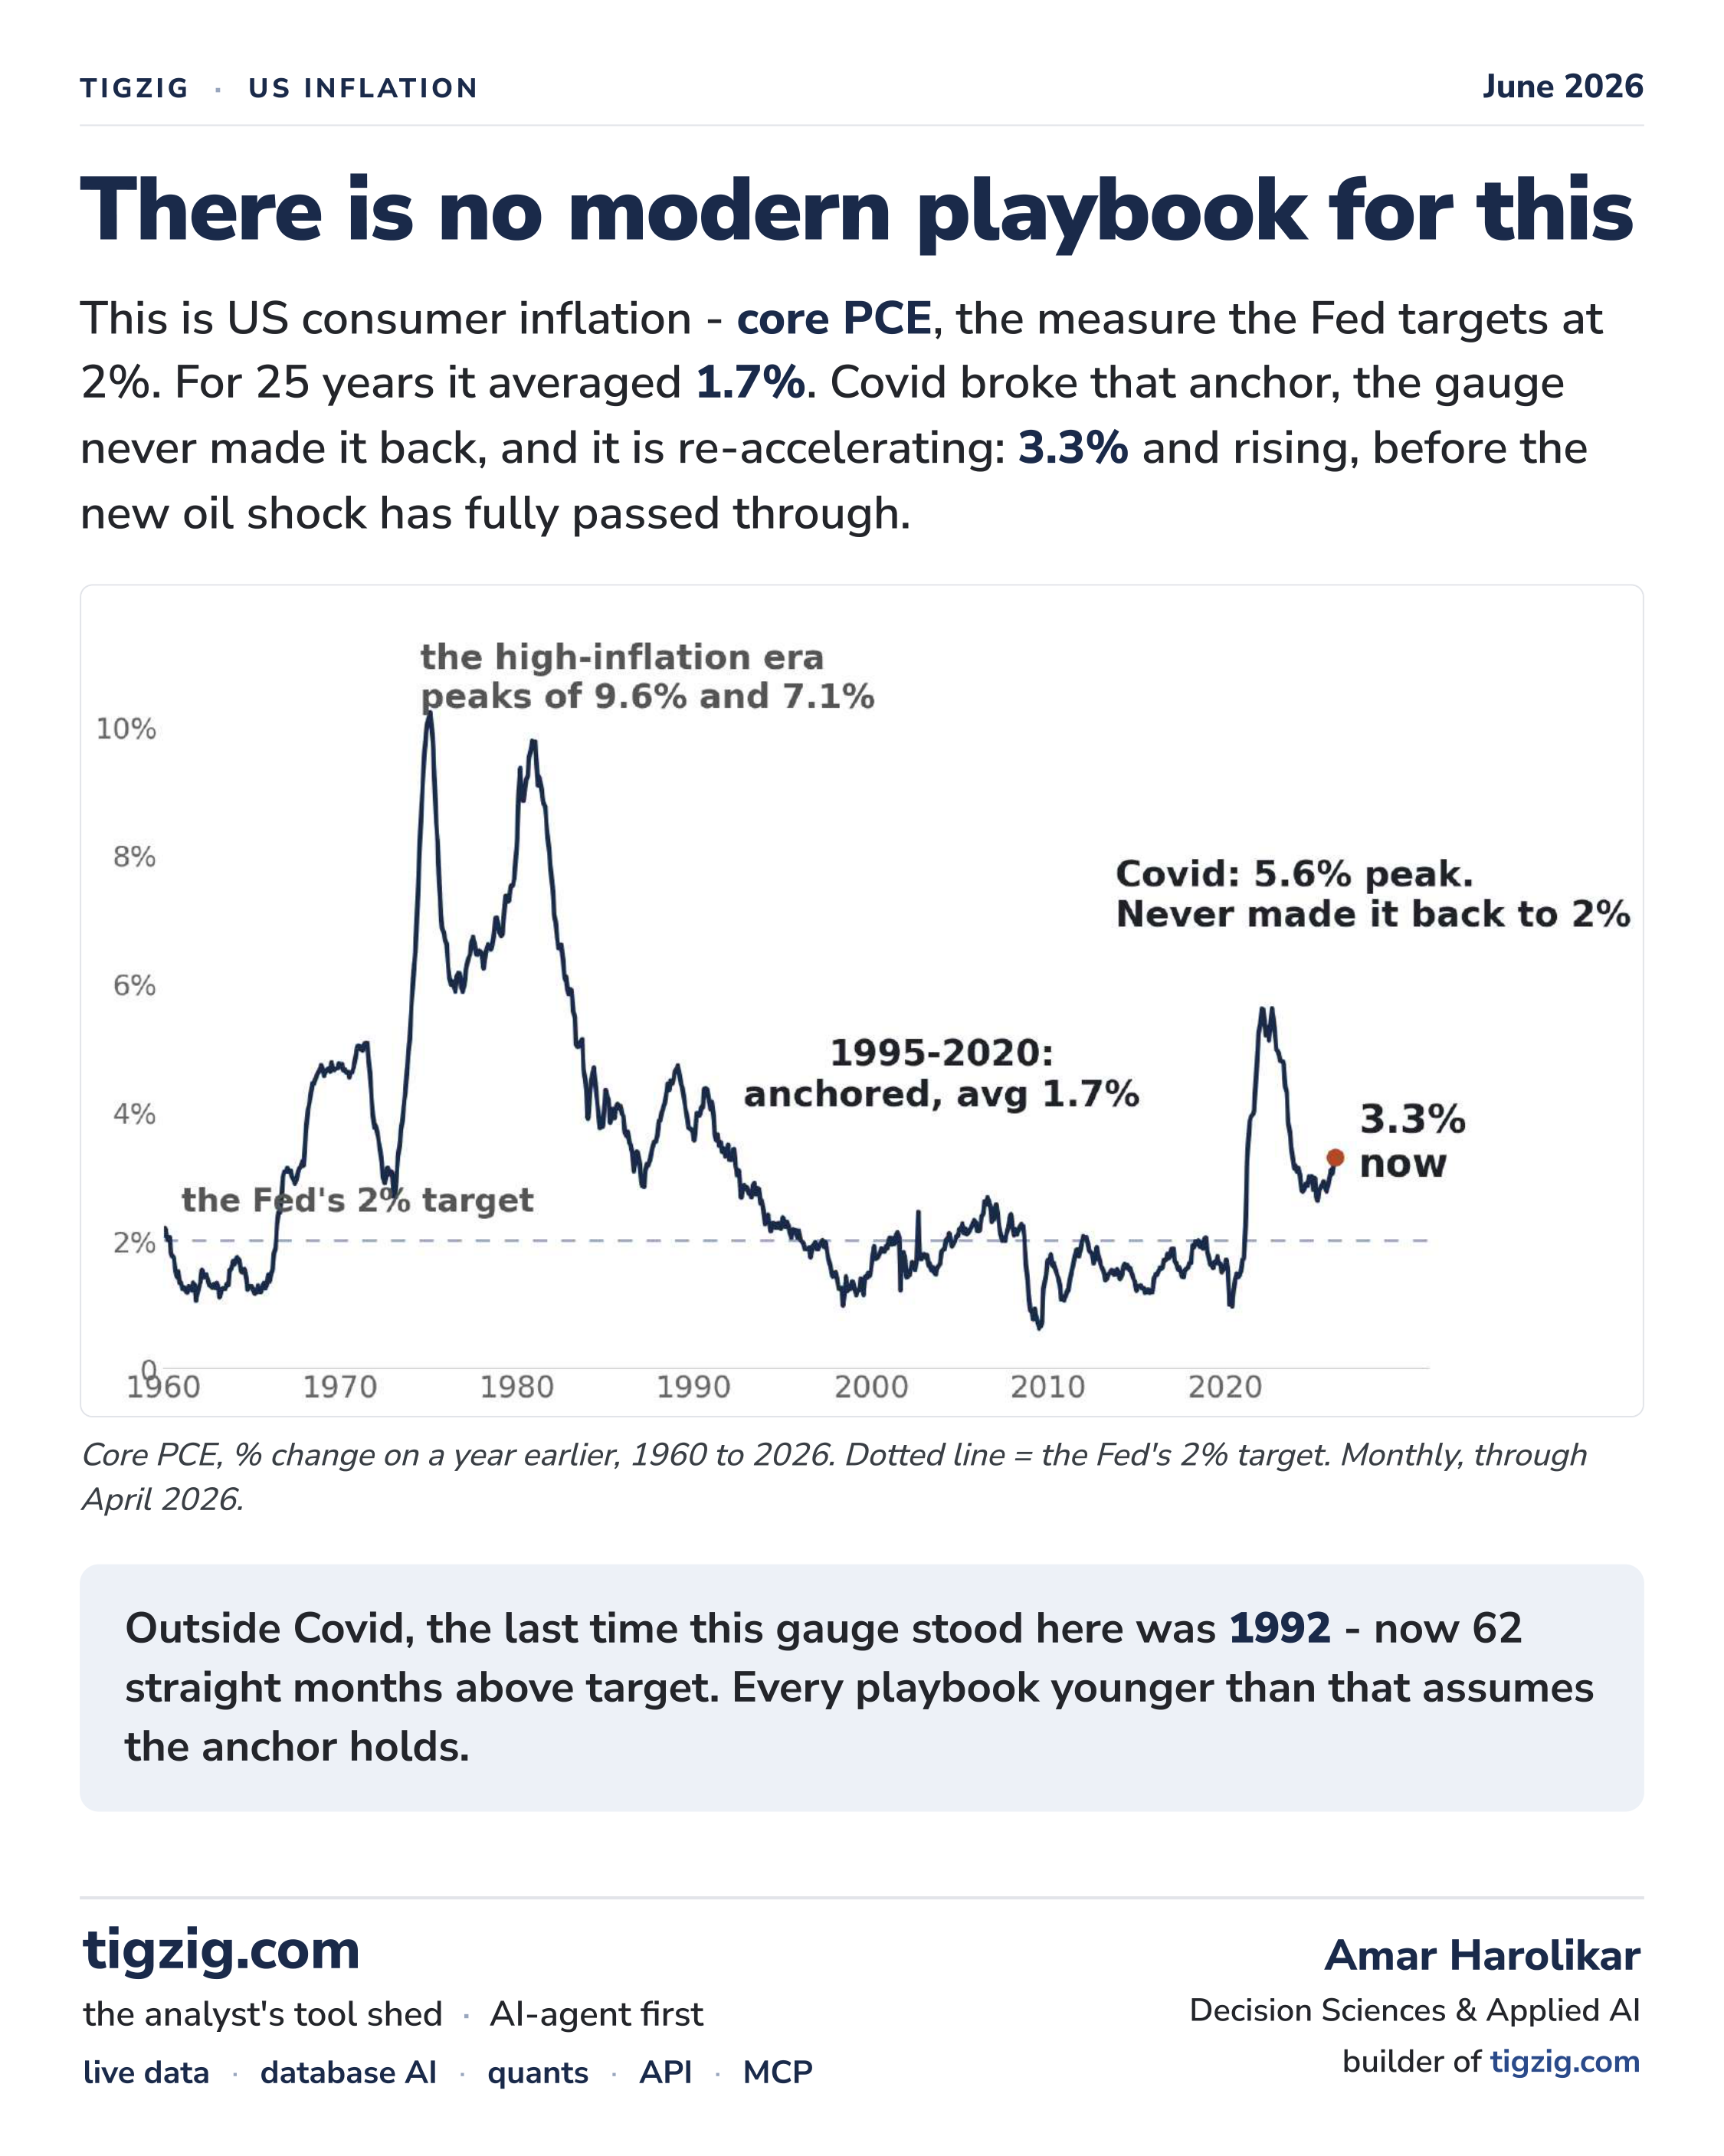
There Is No Modern Playbook for This. US Core Inflation at 3.3%, Re-Accelerating. Producer Prices at 6.4%. Consumer Delinquencies Past 2007.
US core PCE - the gauge the Fed targets at 2% - is at 3.3% and re-accelerating. Outside Covid, last at this level in April 1992. 25-year pre-Covid average: 1.7%. It has now spent 62 straight months above target. And the pipeline says more is coming: PPI final demand at 6.4% - hottest in the modern series outside Covid - with core PPI at 4.9%; PPI is running 2.2 points ahead of CPI, putting the bigger share of the bill on producers (margin compression) but with consumer pass-through inevitable. The consumer is already stretched: gasoline at $4.65 (only June/July 2022 ever higher), and 3.4% of consumer debt is in the 90+ DPD bucket - past the 3.1% mark of late 2007 and more than double the end-2022 low, rising in 12 of the last 13 quarters. Against all of this the S&P set a record at 7,610 on June 2 with Shiller CAPE 2nd-highest in 145 years and Michigan sentiment lowest in 73 years - a handful of AI names doing most of the lifting. The last two times the market was priced like this while the economy cracked underneath - 2000 and 2007 - the index halved. 6-slide deck with full series codes, method, and the dot-com (-49%) / GFC (-57%) drawdown references.
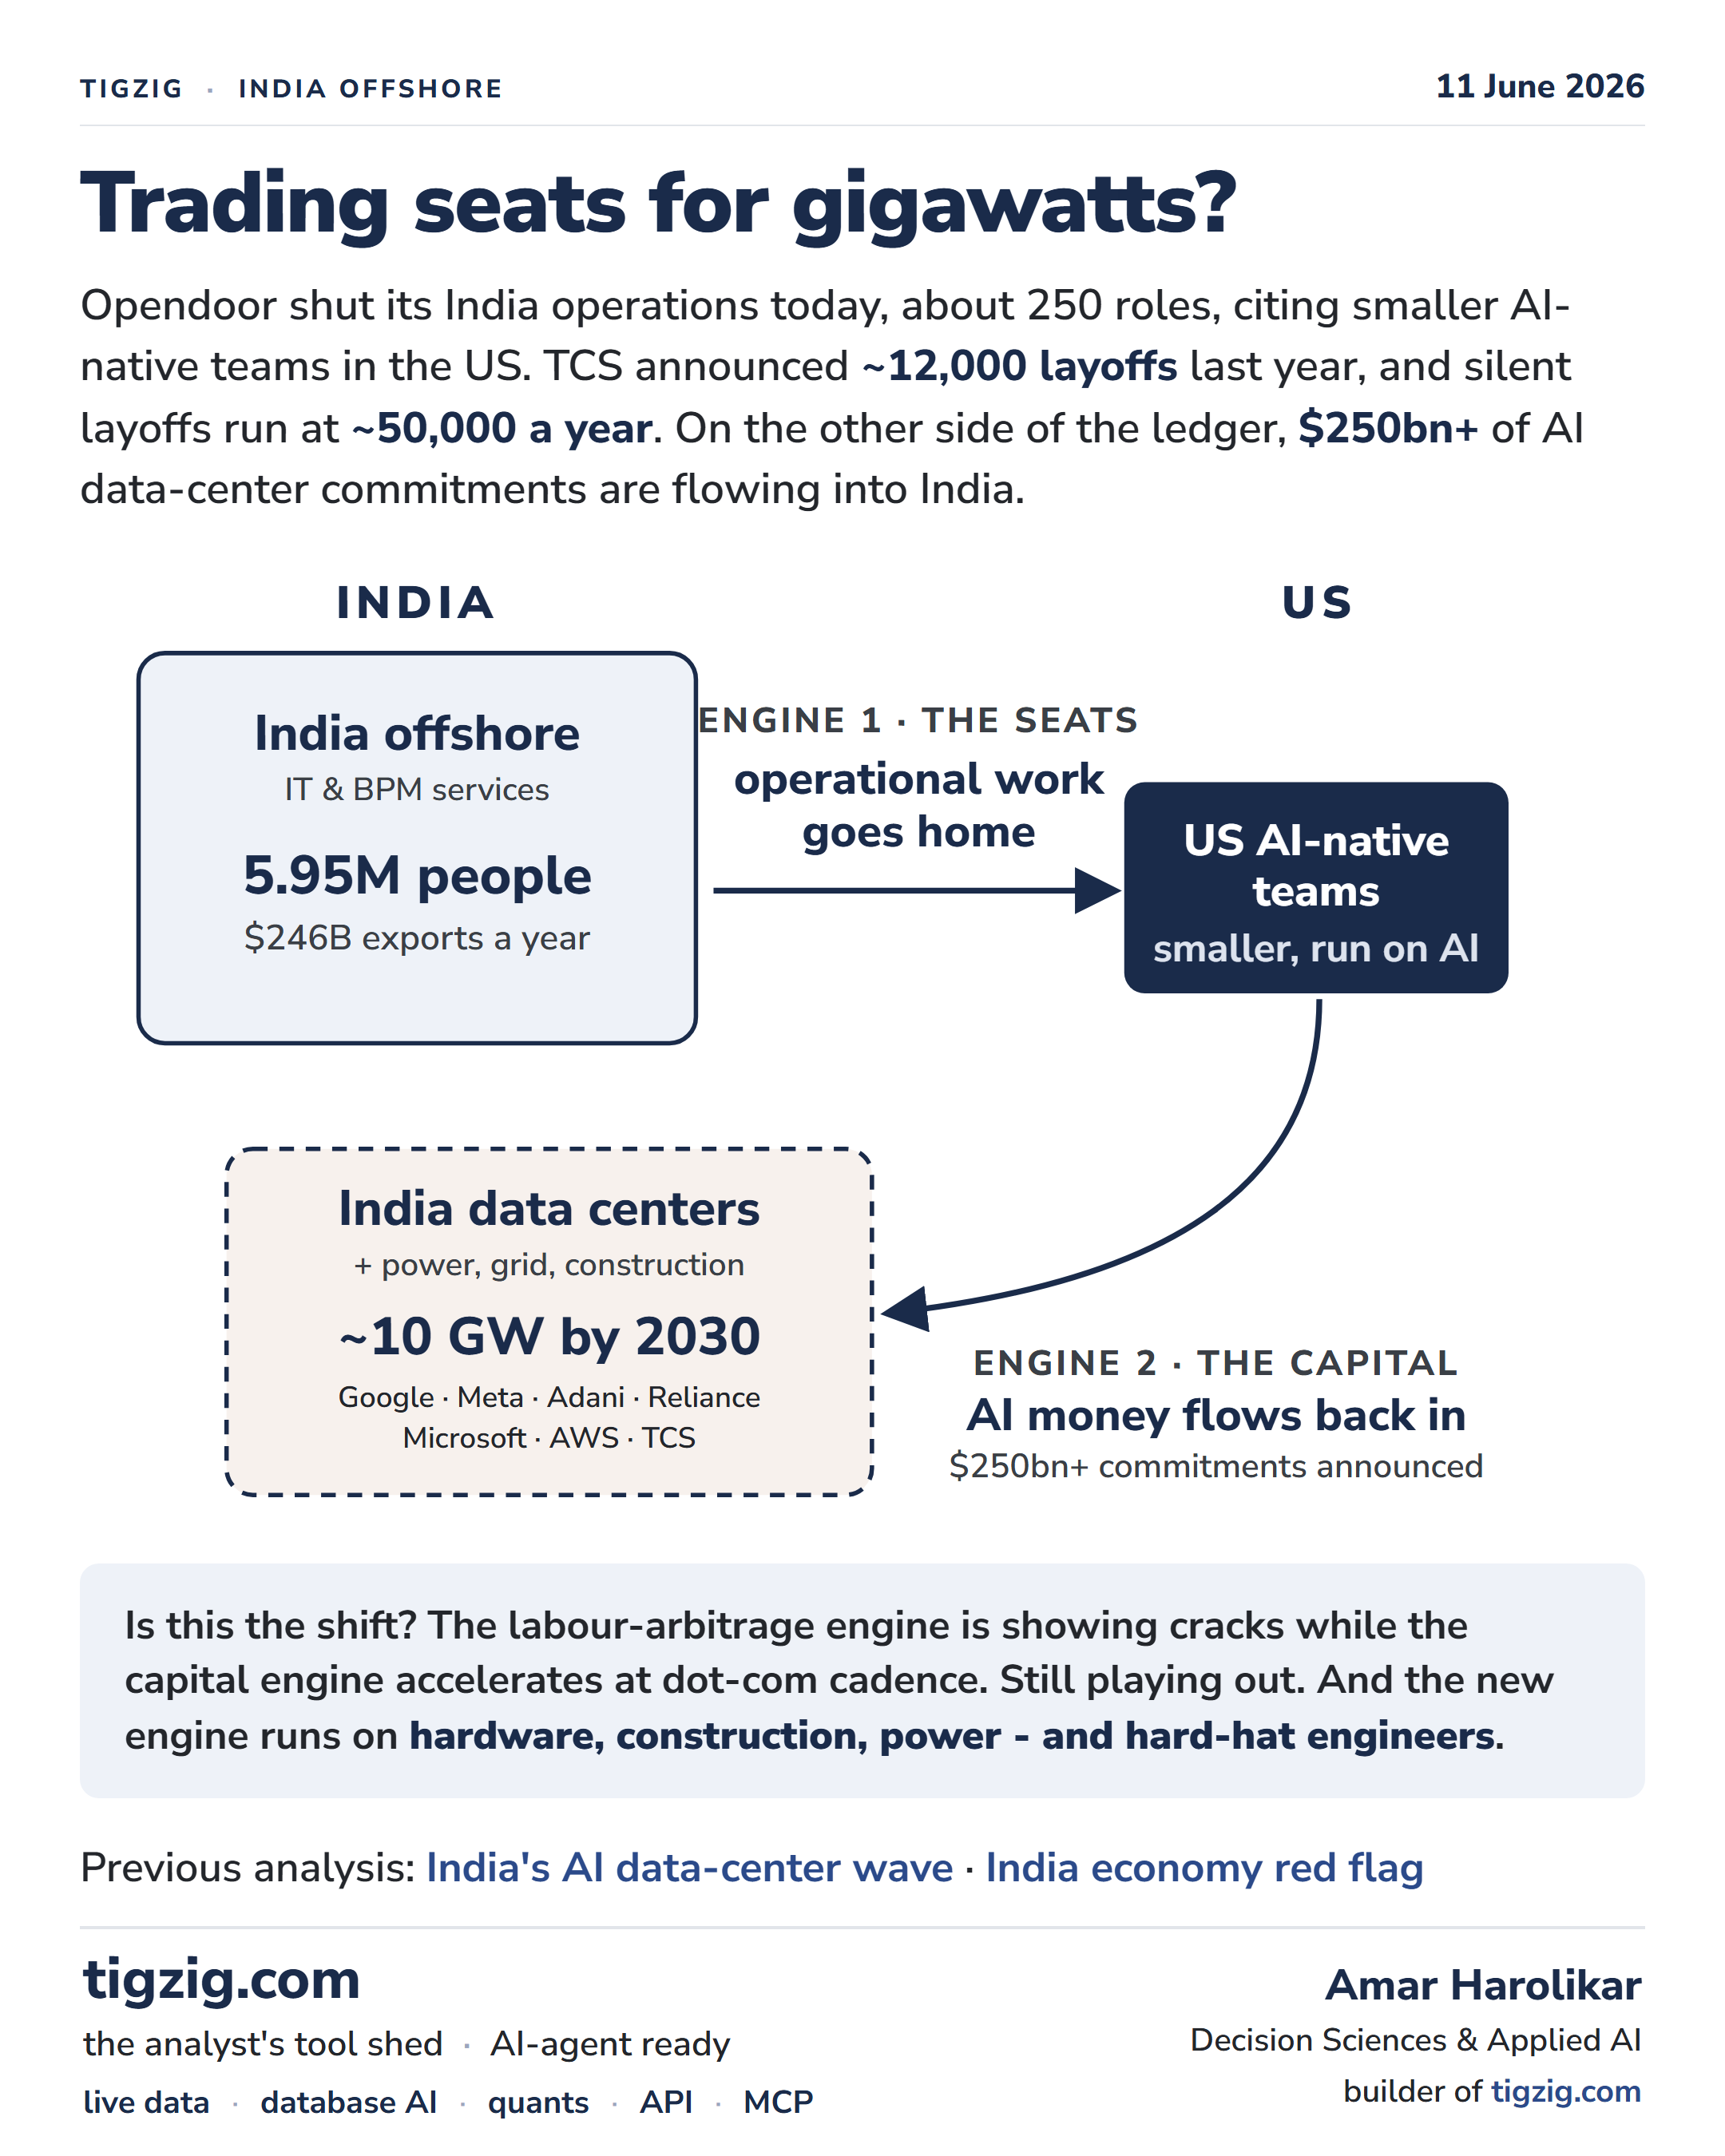
Two Announcements, One Day Apart. Operational Seats Moving Out of India. AI Compute Moving In.
Two announcements, one day apart: Opendoor shut its India operations (~250 FTE) and is shifting to smaller AI-native US teams; Meta signed its first AI data center deal in India. Neither announcement is a first - what caught the eye is both reported within a day of each other. Engine 1, the seats: India offshore IT and BPM employs 5.95 million people and exports $246B a year; TCS announced ~12,000 layoffs last year and silent layoffs run at ~50,000 a year. Operational work is going home to smaller US AI-native teams. Engine 2, the capital: India data centers + power, grid, construction headed for ~10 GW by 2030 with $250bn+ already committed by Google, Meta, Adani, Reliance, Microsoft, AWS, TCS. The labour-arbitrage engine is showing cracks while the capital engine accelerates at dot-com cadence. Is this the real shift? Too early to call. The new engine runs on hardware, construction, power - and hard-hat engineers. Companion to the prior 'India's AI data center wave' and 'India economy red flag' analyses.
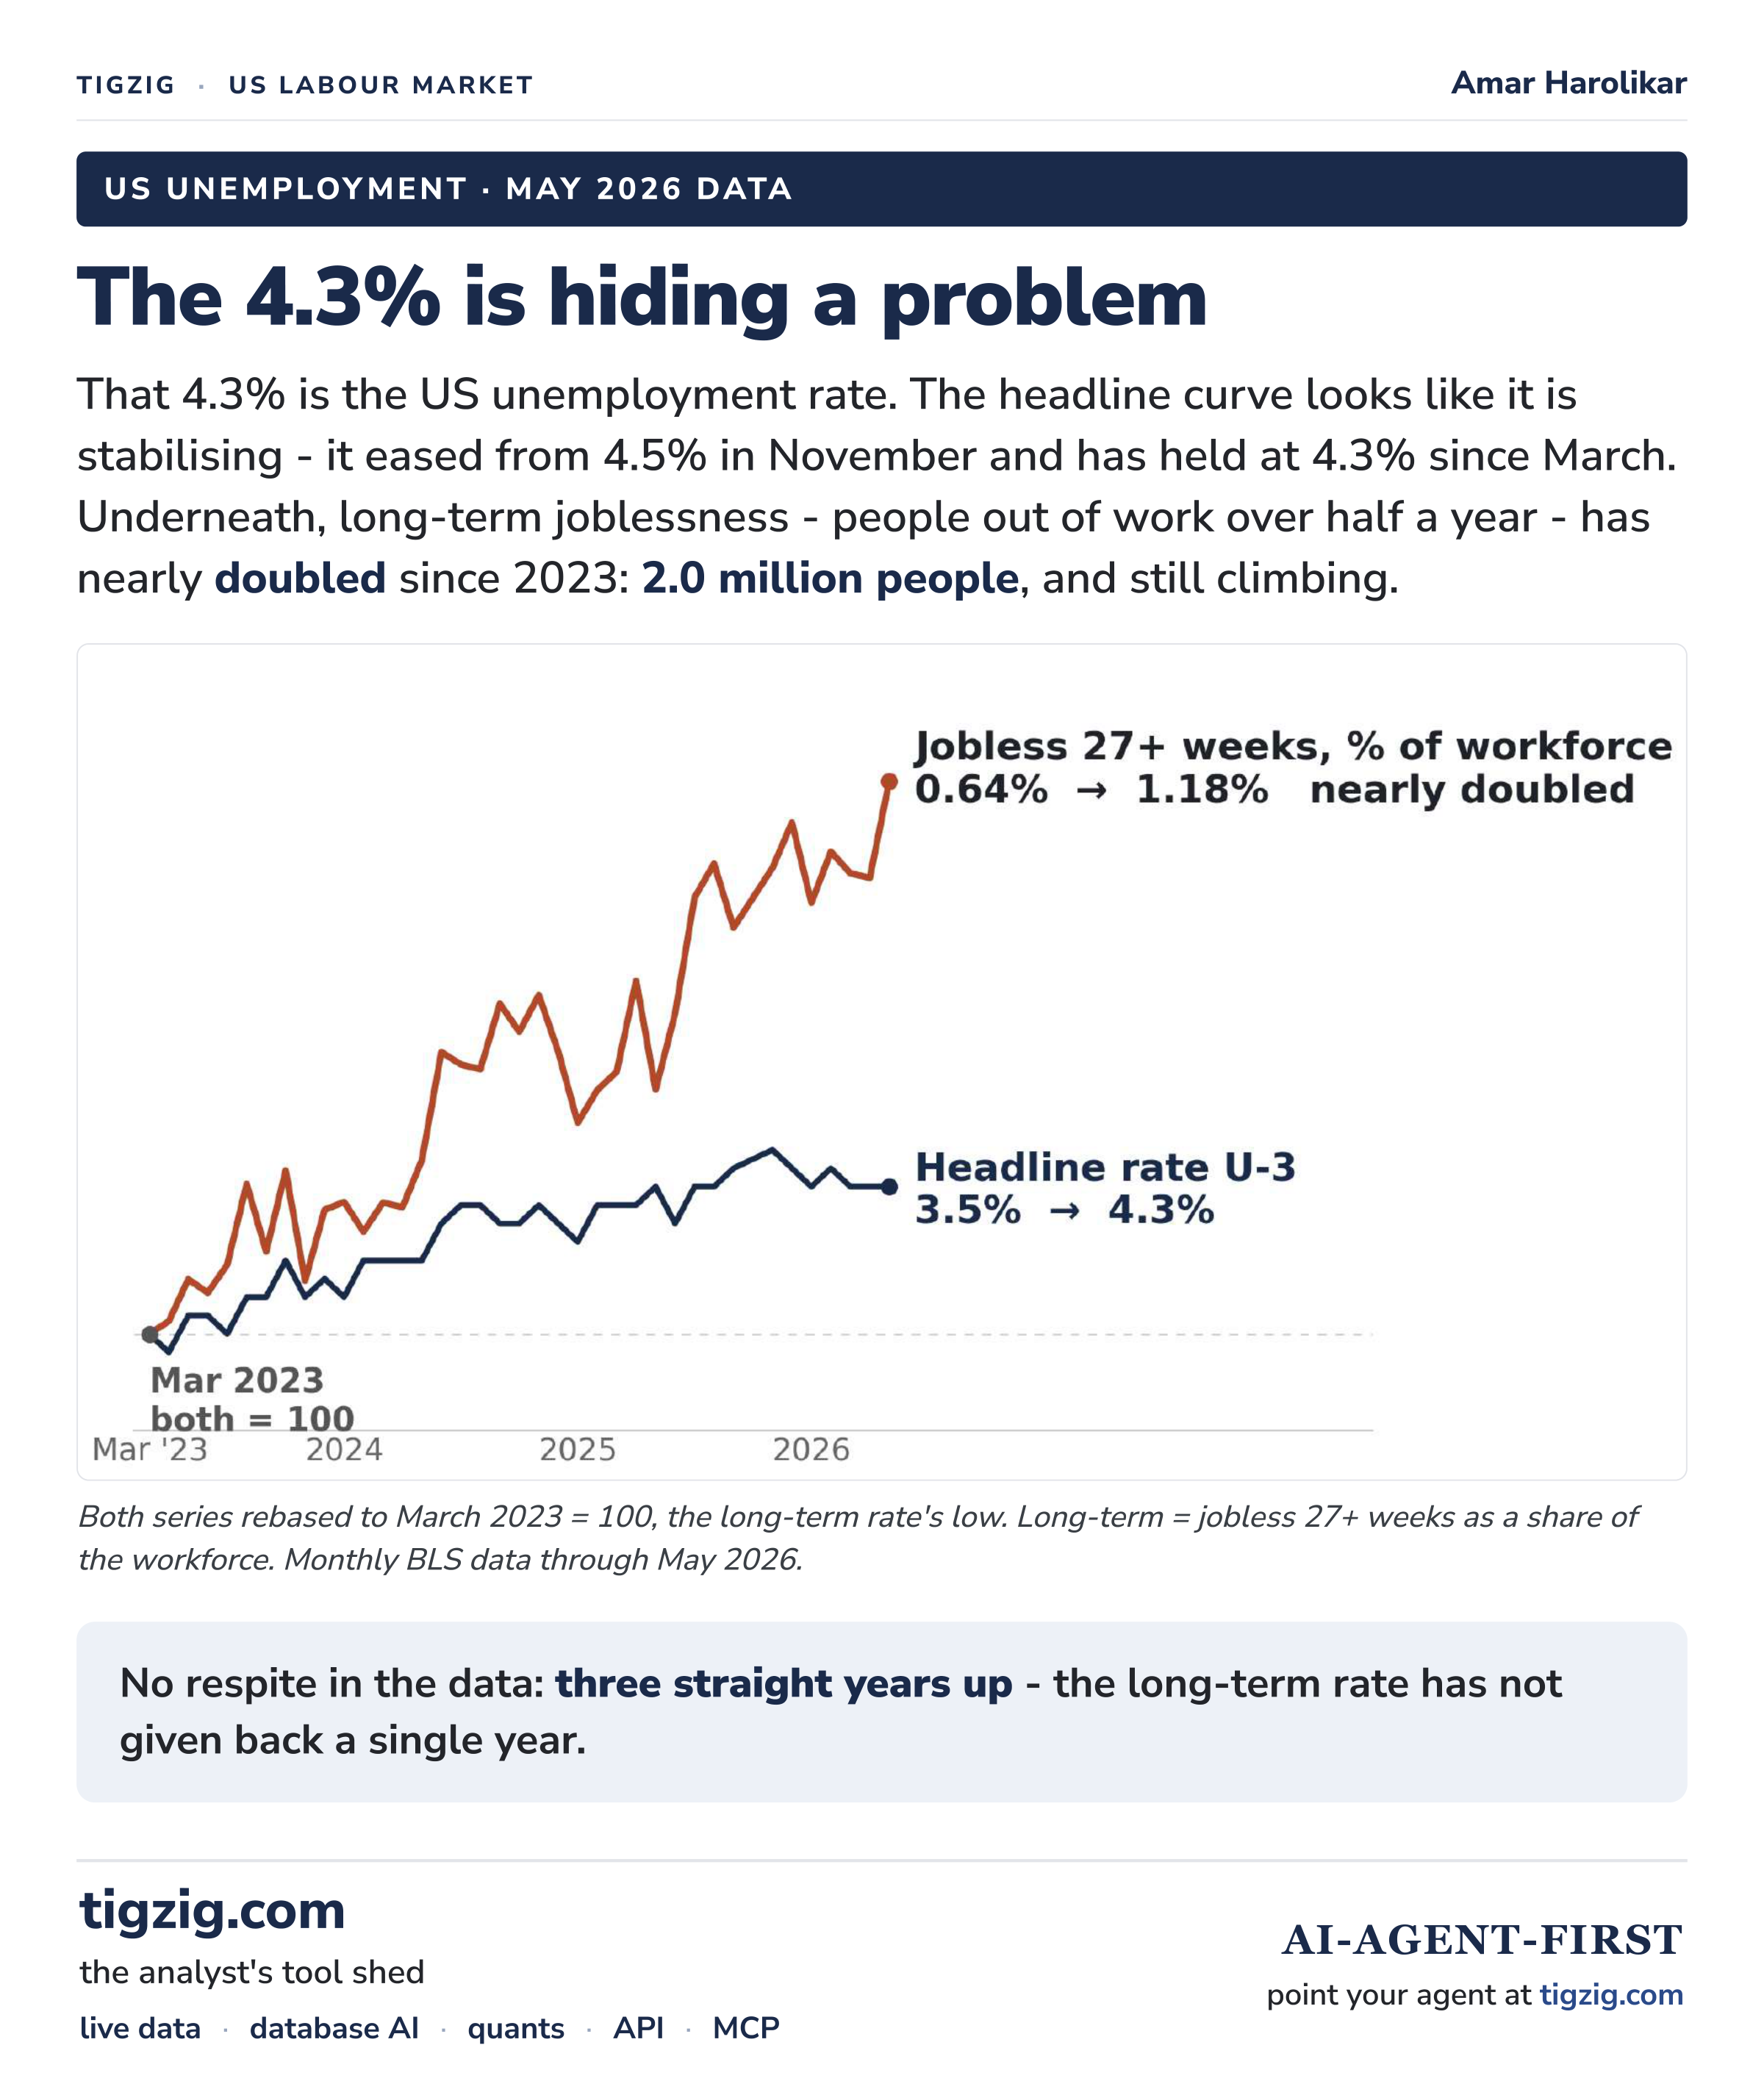
US Unemployment Is 4.3%. The Stuff Underneath Says Otherwise. 2M Jobless Over Six Months, Up 3 Straight Years.
US unemployment is 4.3% and the headline curve looks like it is calming - eased from 4.5% in Nov, held at 4.3% since March. The data underneath says otherwise. Long-term joblessness (27+ weeks) has nearly doubled since 2023 to 2.0 million people, with three straight years up and no give-back. When long-term pulls away from the headline like this, that is the 2008 pattern - into 2008 the long-term line towered about 6x its pre-crisis level while U-3 only doubled. Covid never had this shape; rehiring was too fast. Today's rise has the slow-grind 2008 shape, with no recession to blame. Composition: the long-term share fell to 17.8% after Covid (Feb 2023) and is back to 27.5% now (GFC extreme was 45.5%) - more than one in four of the unemployed are now past the line that scars. Structural test: measured against the whole workforce, long-term joblessness has stepped up once in 25 years - 0.53% to 0.81% in the dot-com era. This cycle is at 1.18% in May and still rising. Is AI doing to the jobless floor what dot-com did? Too early to call - the test comes when this cycle finally turns. Fits the picture from last week's note: consumer sentiment at a 73-year low, valuations near 145-year highs. 5-slide deck on BLS / FRED data through May 2026.
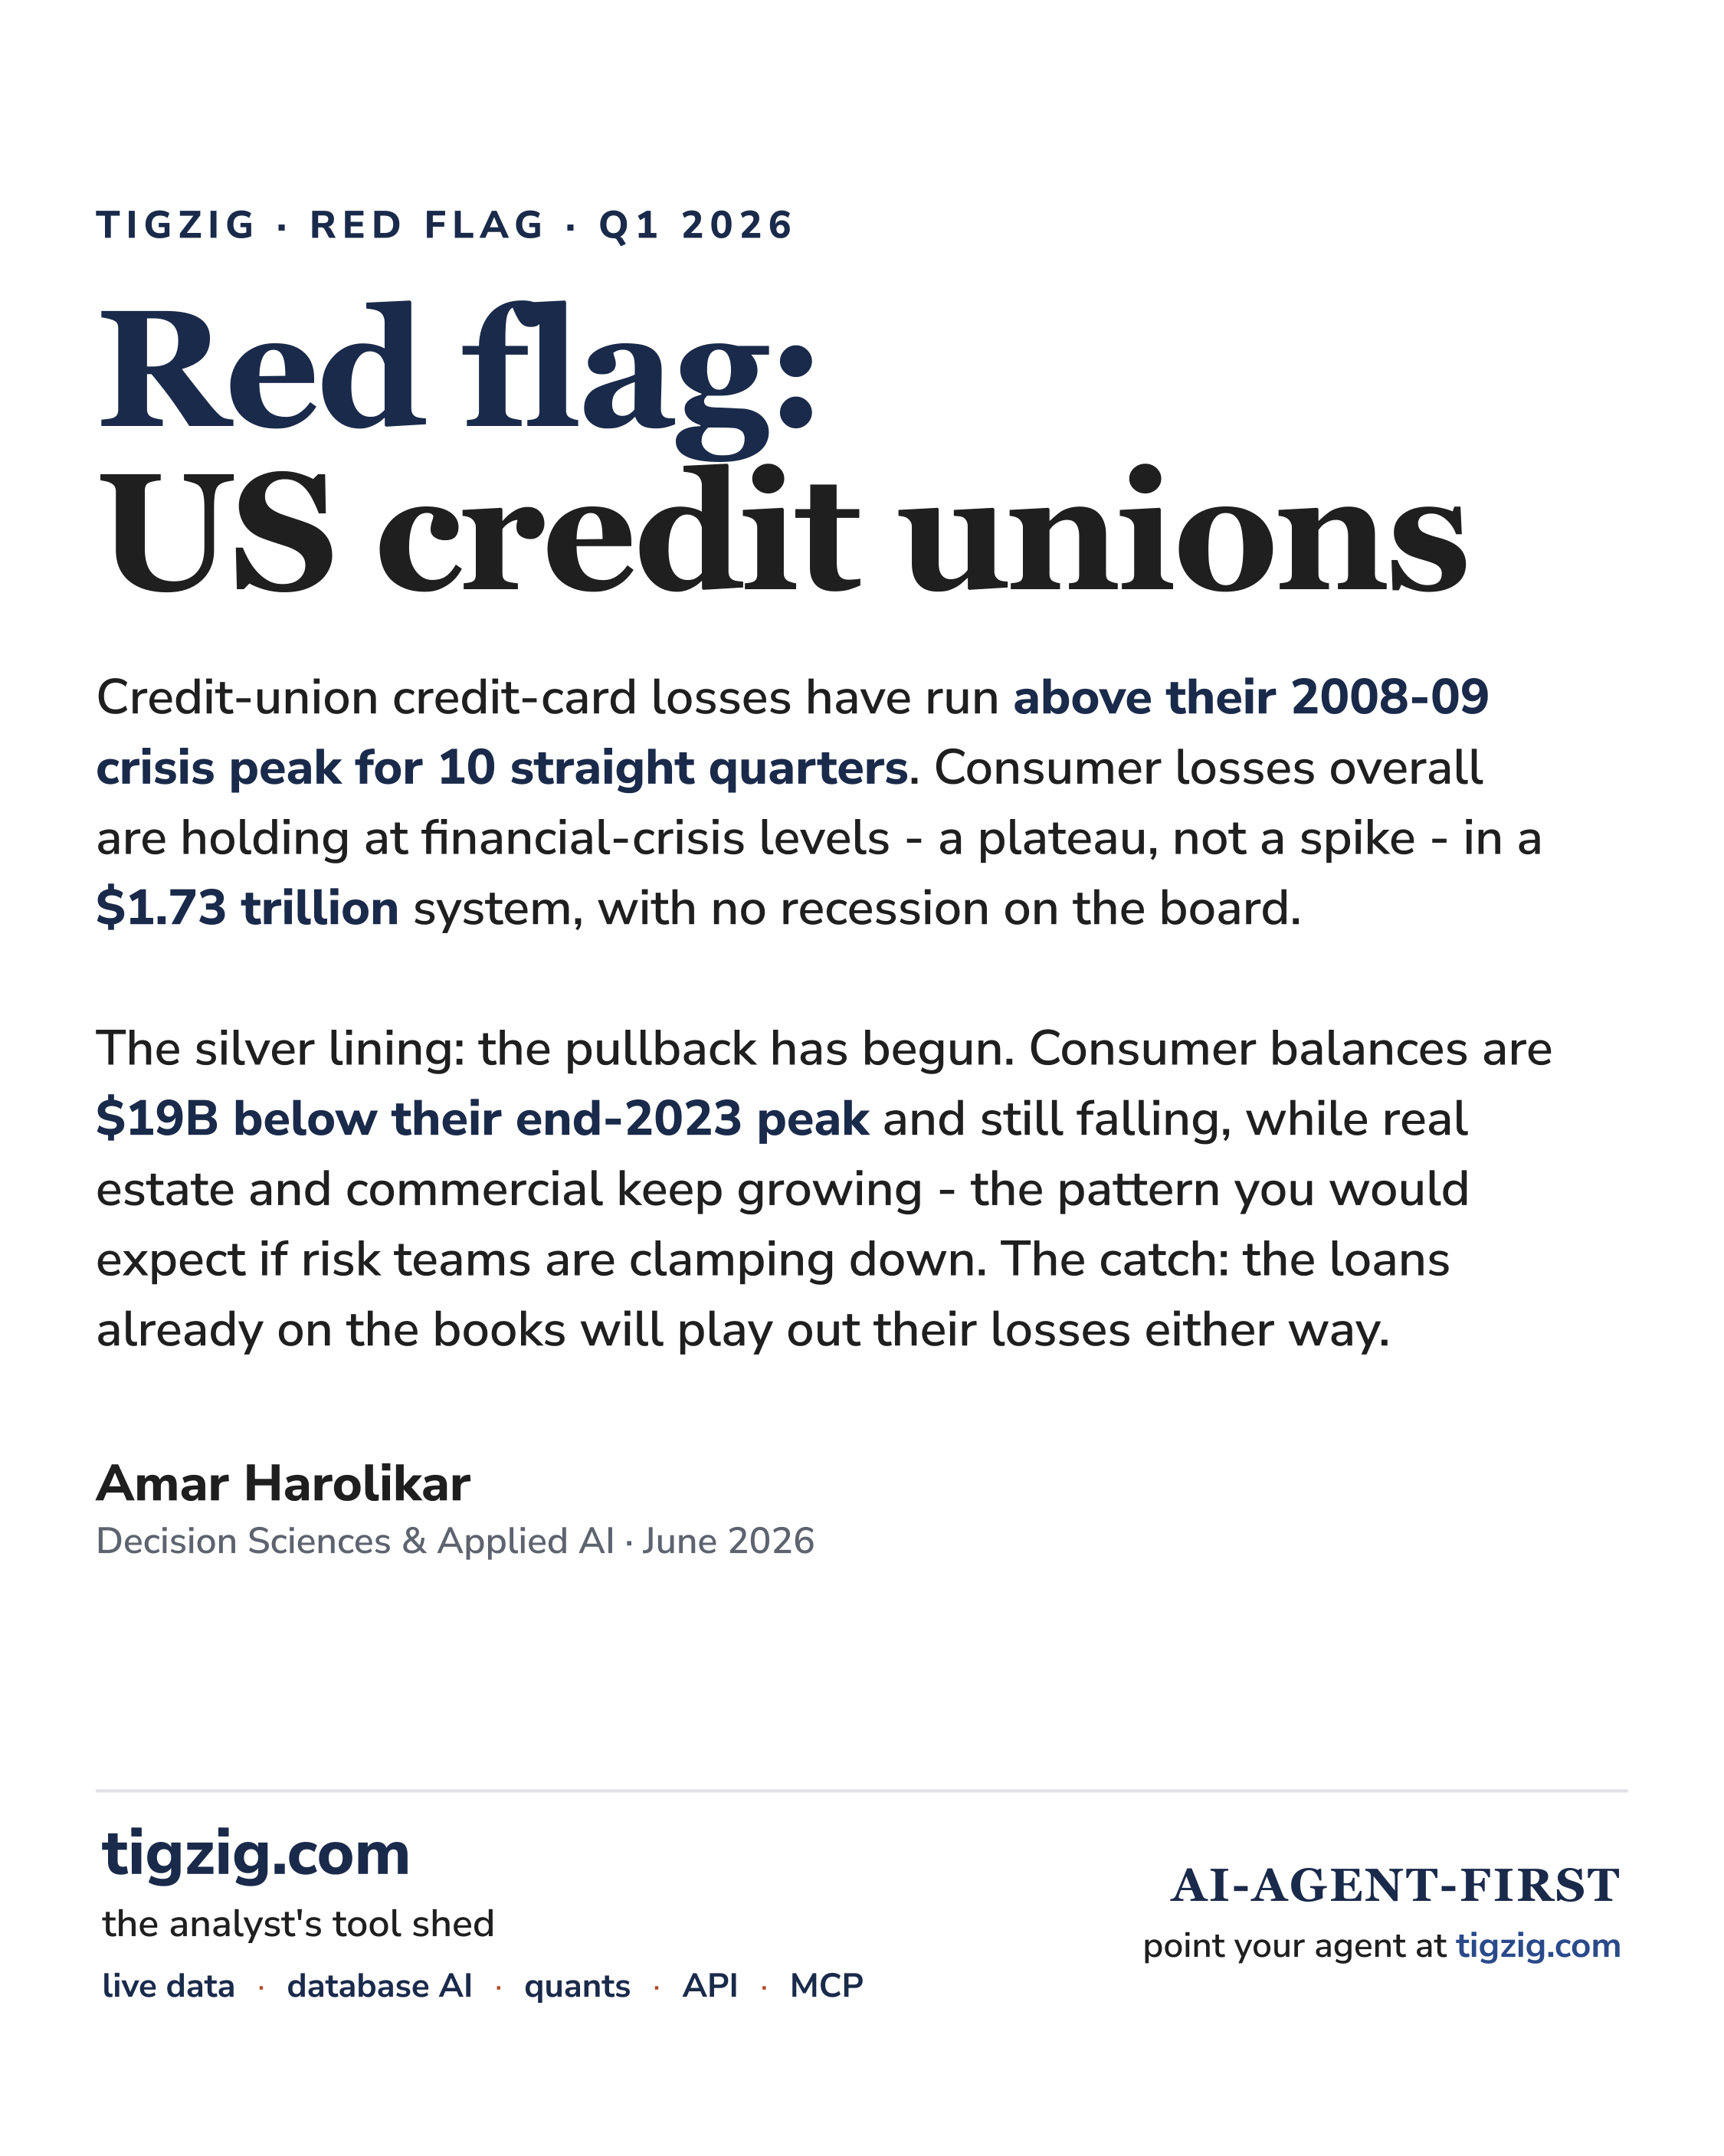
Red Flag: US Credit Unions. A $1.73T System at GFC-Era Losses. Card Charge-Offs 10 Straight Quarters Past the Crisis Peak.
Red flag on US credit unions - a $1.73 trillion lending system running GFC-level losses in consumer, with no recession on the board. Card charge-offs hit 5.30% in Q1 2026, above the 2008-09 crisis peak (4.68%) for 10 consecutive quarters - a plateau, not a spike. Real estate and commercial are calm (59% of loans, 4% of losses). Consumer is 41% of loans and 95% of losses, with auto NCO at a fresh series record (0.97%) and cards at 33% of all CU loan losses. Measured vs each sector's own GFC peak: credit unions are at 113% on cards (past), banks just 38% - this is not system-wide banking stress, it is concentrated in credit unions. The silver lining: consumer balances are $19B below their end-2023 peak and falling, the shape of a deliberate tightening - but vintages already booked will run their loss curves. The Share Insurance Fund equity ratio is at 1.30% (below the 1.33% normal operating level); a wave could force a premium assessment on every surviving credit union (precedent: 2009-10 corporate CU crisis). The NCUA is run by a single board member - the other two were removed in April 2025, dispute now at the Supreme Court. Banks have Jamie Dimon. Credit unions have nobody. 13-slide carousel deck with full method, source notes and the failure-channel transmission path. Companion to the prior 'Auto Past the GFC Peak. Cards Almost There' post.
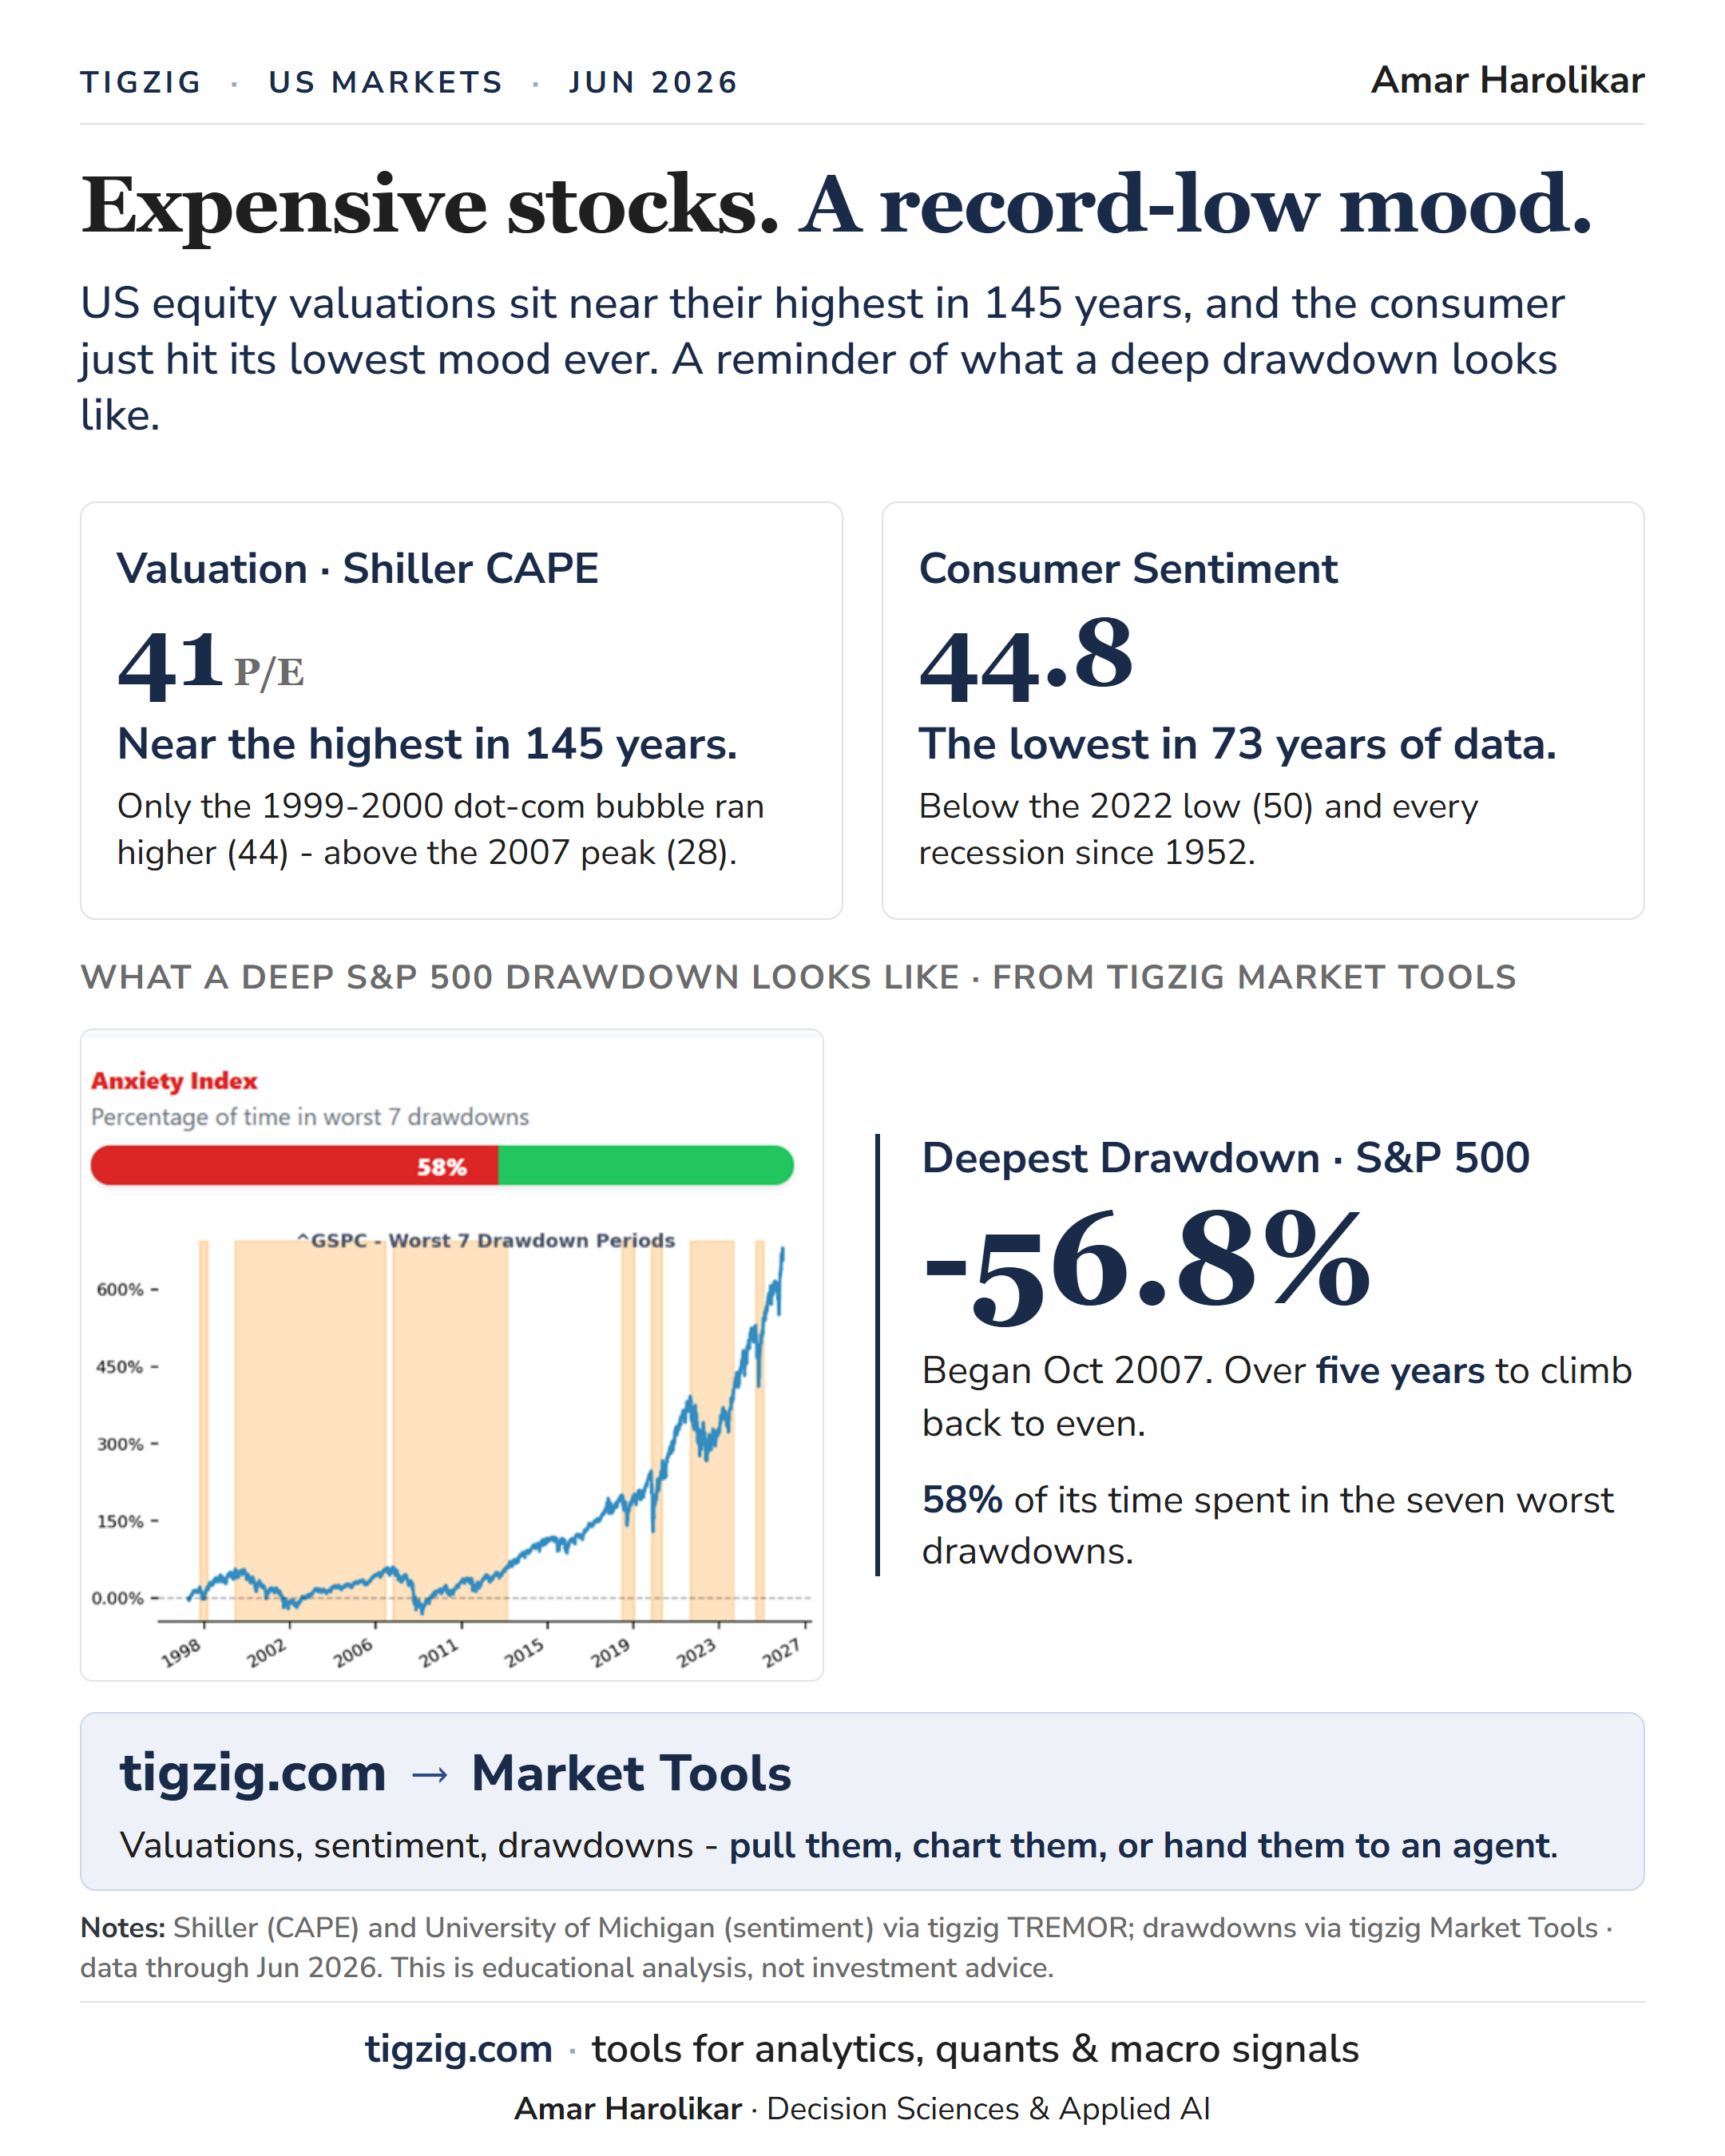
Index at a Record. Peak Valuation. Record-Low Sentiment. Last Two Times This Setup Held - 2000 and 2007 - the Market Halved.
Index at a record. Peak valuation. Lowest sentiments. And the economy cracking. Last two times the market was priced up here - 2000 and 2007 - it halved. Shiller CAPE near 41 P/E, the highest in 145 years apart from the 1999-2000 dot-com bubble (44), above the 2007 peak (28). University of Michigan consumer sentiment at 44.8, the lowest in 73 years of data - below the 2022 low (50) and every recession since 1952. In dot-com it was all about page views with no line of sight on revenues; in 2026 it is all about compute and revenues with no line of sight on cash profitability. Companion to the prior 'Irrational Exuberance' note when the S&P was at 7,400. Consumer delinquencies high, unemployment high, producer prices the hottest in 25 years (excl Covid), oil and gasoline high, consumer stretched. Seven stocks doing most of the lifting in the index. Dimon called it too much exuberance. Buffett sitting on the biggest cash pile in Berkshire's history. Drawdown ground-truth from tigzig Market Tools: S&P 500 deepest -56.8% beginning Oct 2007, over five years to climb back to even, 58% of its time spent in the seven worst drawdowns. Not investment advice.
Auto Losses Past the GFC Peak. Cards Almost There. Credit Unions Already at GFC Loss Rates. NY Fed + NCUA Data Now on Tigzig.
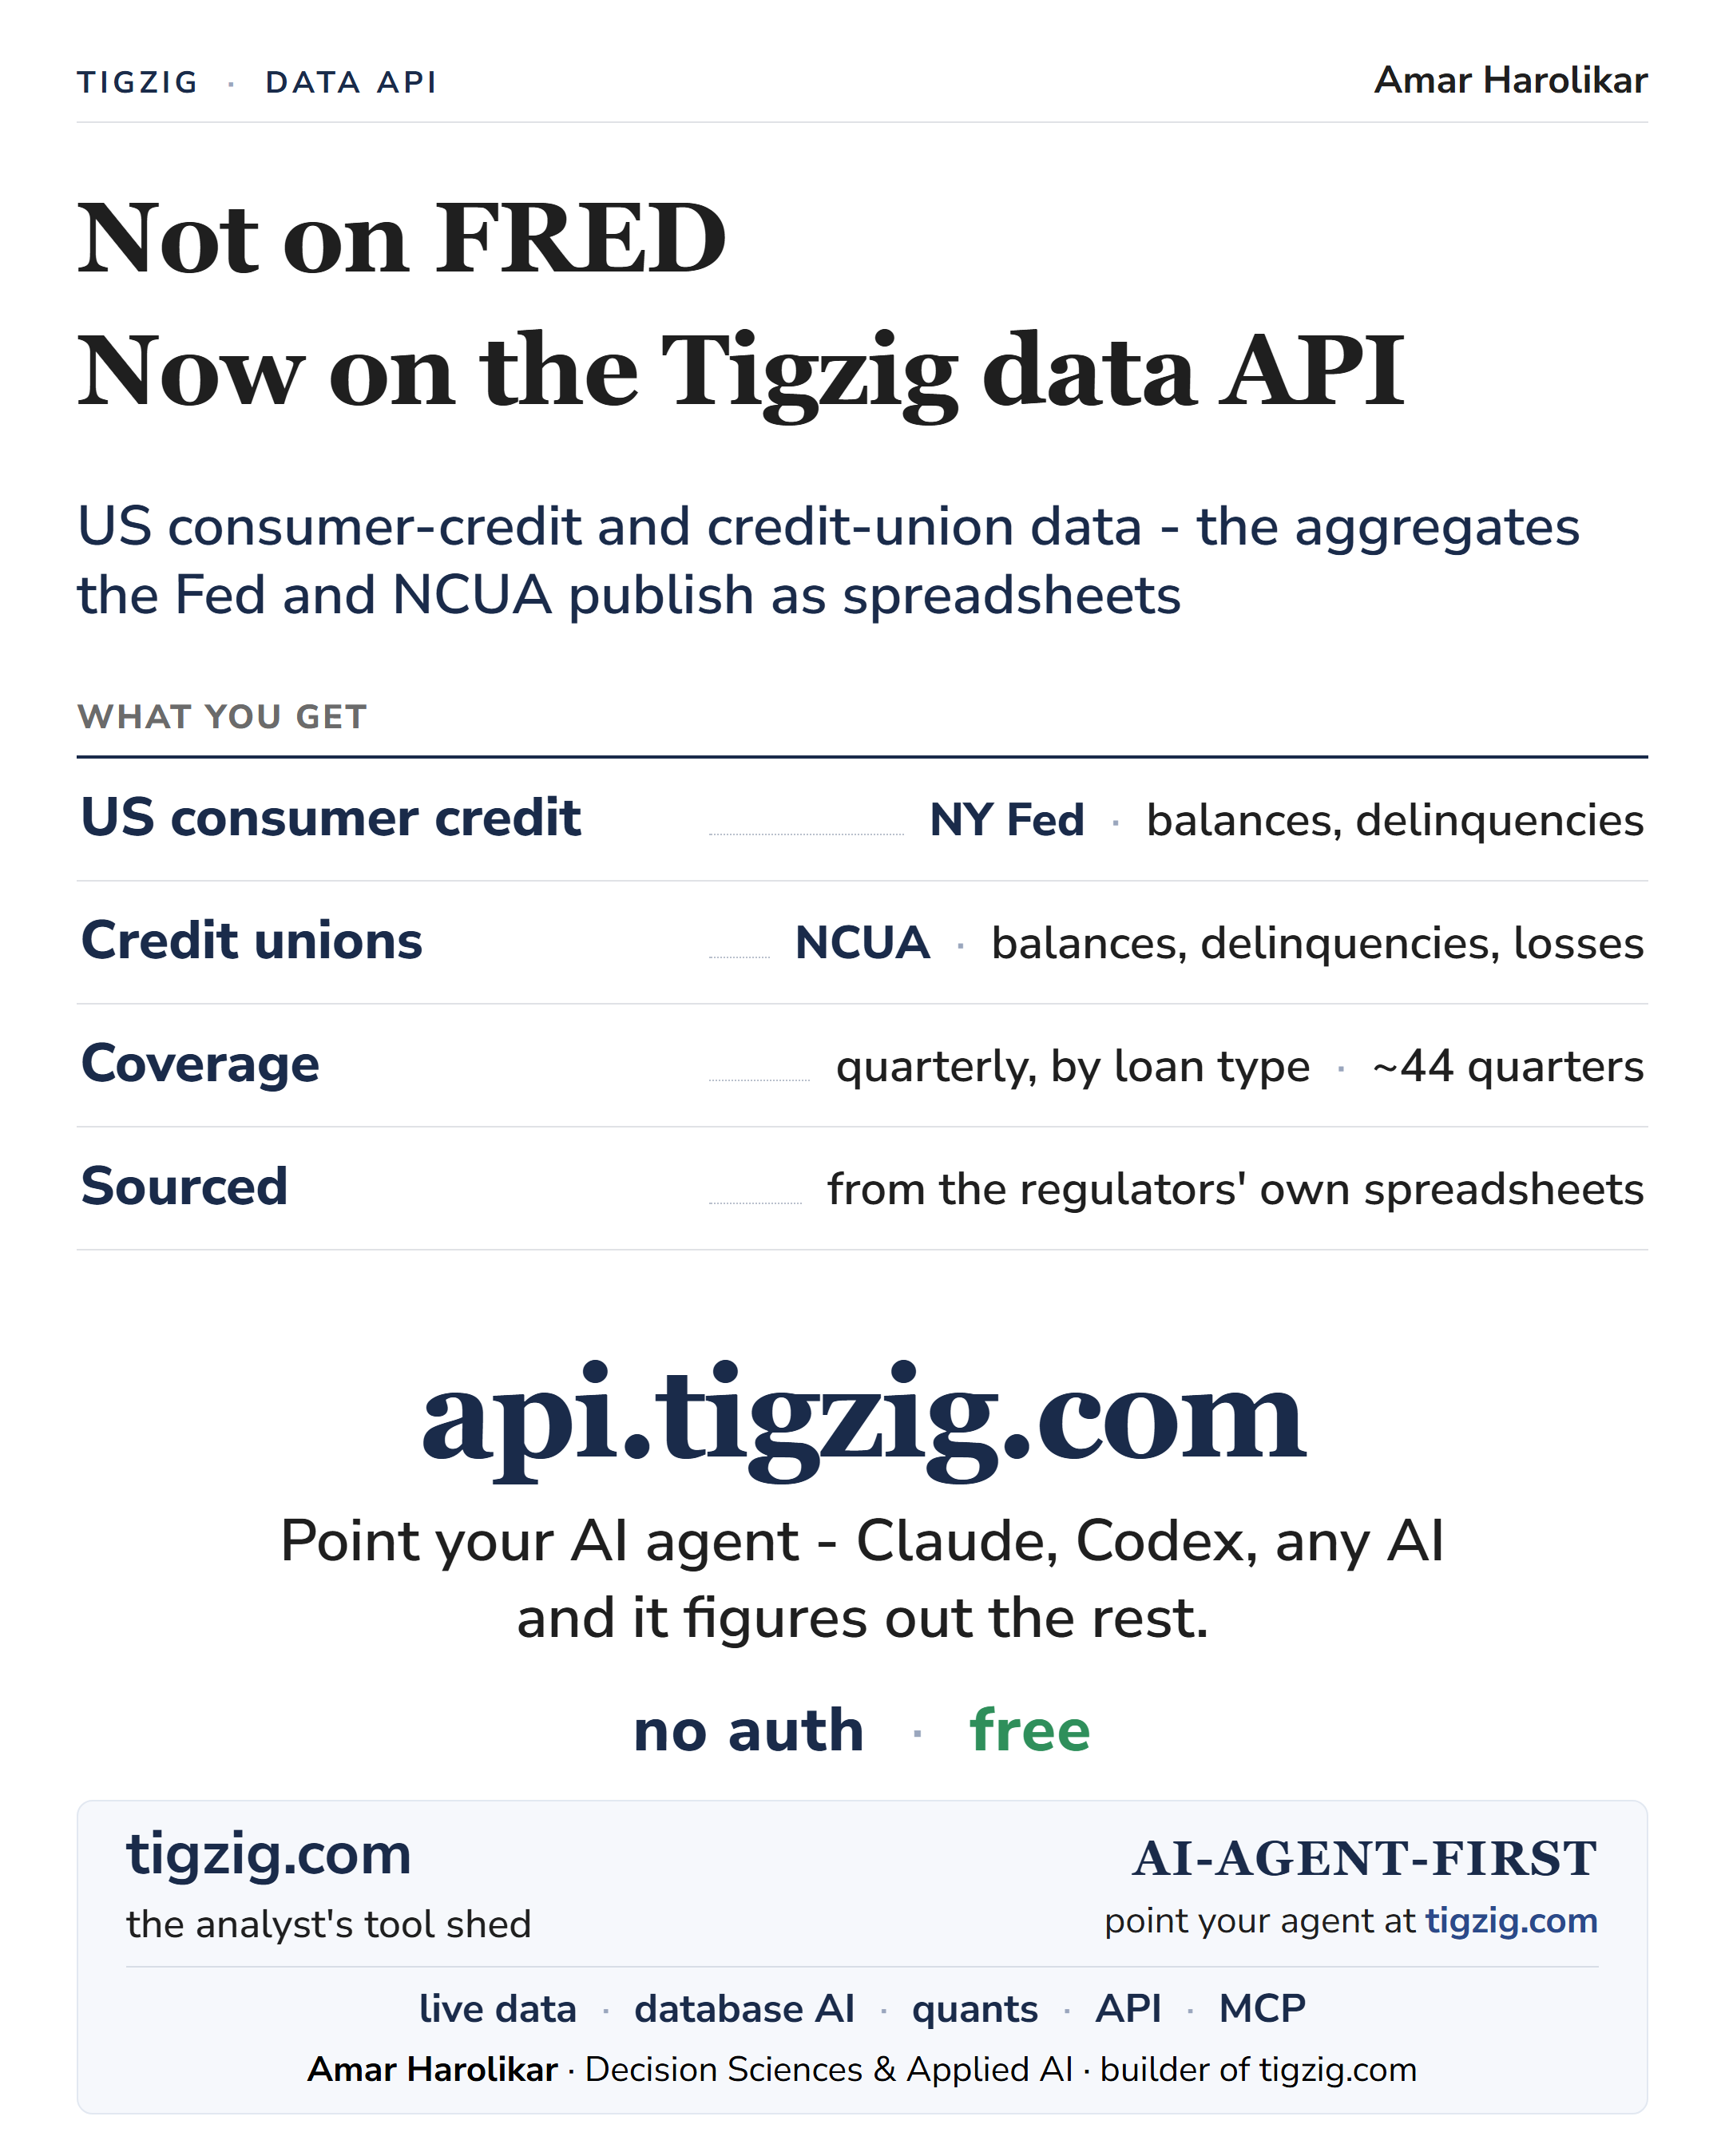
NY Fed and NCUA aggregate loss / delinquency data comes out as a spreadsheet - pain to analyze. Pulled, disaggregated by quarter, validated and loaded into a database with an interface (tigzig.com -> TREMOR), an API (api.tigzig.com) and an MCP layer (mcp.tigzig.com). Quarterly coverage, by loan type, ~44 quarters, sourced from the regulators' own spreadsheets. And the data is talking loudly. Bank charge-offs look fine on the surface but the pressure is one step away from the banks: auto losses past the GFC peak, cards almost there. Credit unions running loss rates last seen during the GFC period - overall, consumer and cards; the card book has already pushed past its 2009 peak. And banks keep funding non-bank lenders - $1.65T to non-banks in Q1, up 42% in five quarters.
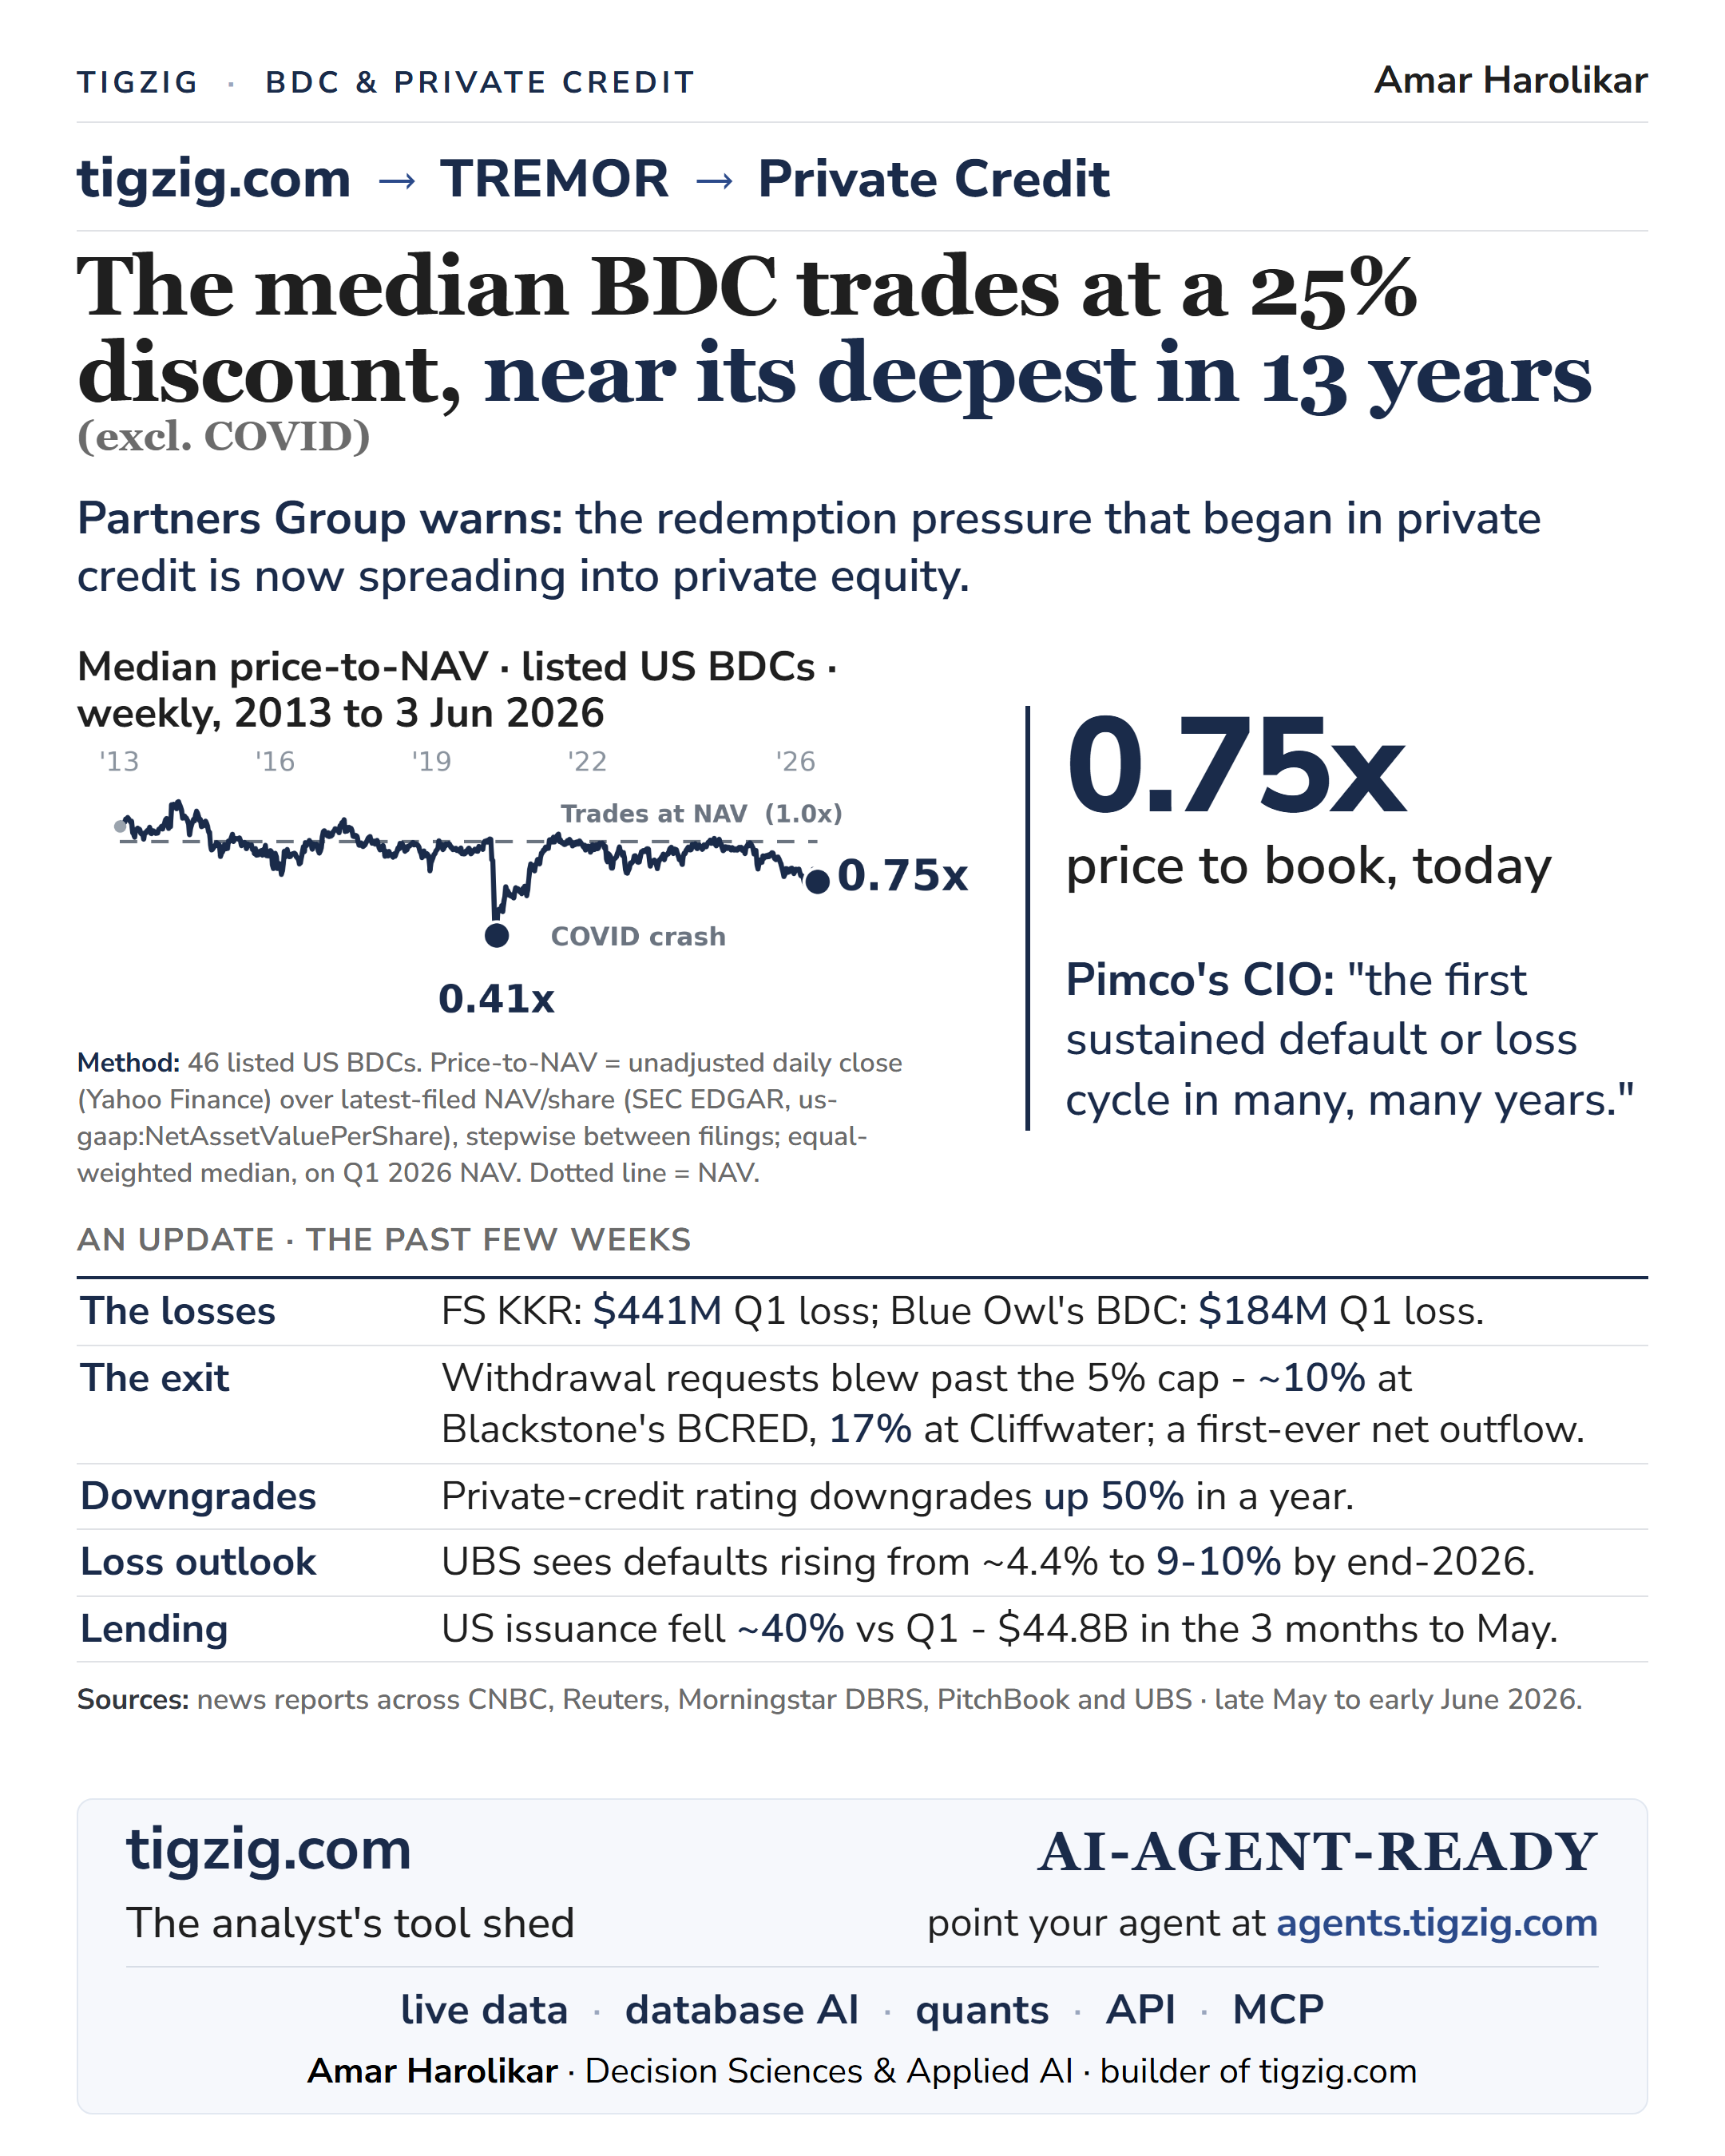
Private Credit and BDC Stress. Discounts at 13-Year Lows. Withdrawals Past the Gate. Regulators Now Arriving.
The median listed BDC trades at 25% discount to NAV, near its deepest in 13 years excluding Covid - 0.75x price to book today. Pimco's CIO: 'the first sustained default or loss cycle in many, many years.' Q1 losses: FS KKR $441M, Blue Owl's BDC $184M. Withdrawal requests blew past the 5% redemption gate at Blackstone's BCRED (~10%) and Cliffwater (17%) - a first-ever net outflow. Private-credit rating downgrades up 50% in a year. UBS sees defaults rising from ~4.4% to 9-10% by end-2026. US issuance fell ~40% vs Q1 to $44.8B in the 3 months to May. Partners Group warns the redemption pressure that began in private credit is now spreading into private equity. The regulators have started arriving: federal prosecutors in NY questioning BlackRock executives over how their credit fund valued loans; FSB flags private credit's leverage and interconnections as a source of broader risks to financial stability; ECB puts US private credit on its watchlist as a spillover risk into Europe; Sarah Breeden at the Bank of England calls it a potential 'market for lemons' (Akerlof). Companion update to the prior 'Is Private Credit Turning Into a Lemon' analysis.
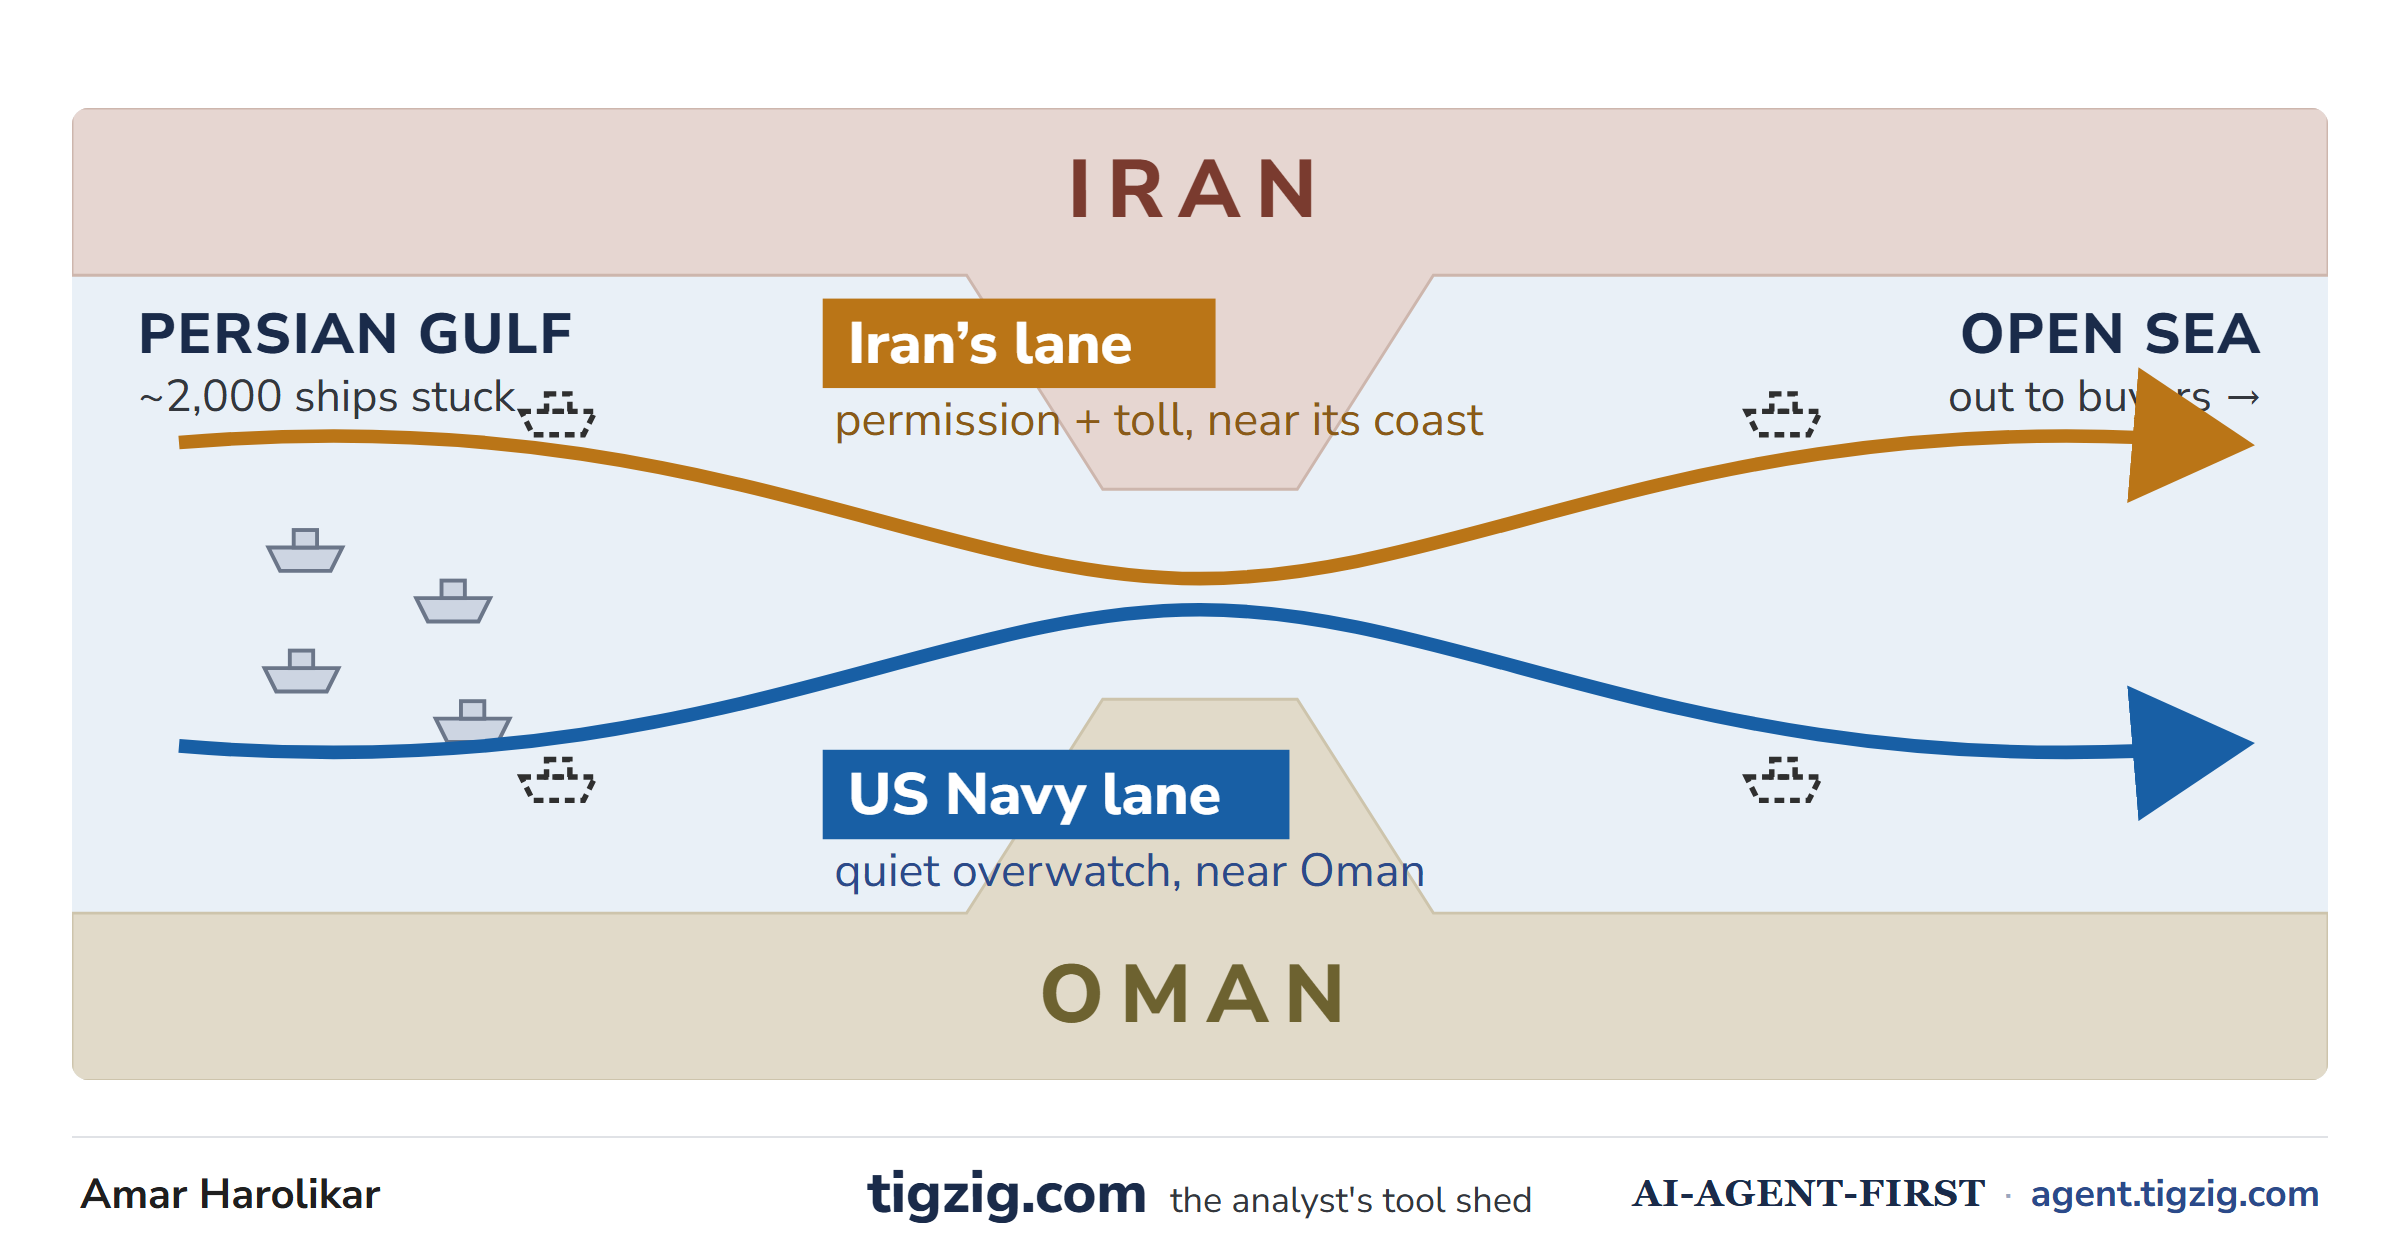
Hormuz Is Quietly Opening. The First Good News in 100 Days. And It Is Running in Two Lanes.
A trickle of tankers is getting out of the Strait of Hormuz again - the first real relief after more than three months of a shut chokepoint. But how they are getting out is the interesting bit. There is not one quiet arrangement, there are two. One lane Iran controls and charges a toll for, close to the Iranian coast (most traffic this way - CSIS says half the vessels since early March are from just four countries with China at the top). One lane the US Navy quietly watches over near the Oman coast - mines cleared, ~70 ships guided through in three weeks per New York Times sources; officially the US says it is not escorting, just coordinating. Tankers go dark on both sides - on Iran's lane to stay off the Western sanctions record, on the US lane to not broadcast their position to Iran. Use Iran's lane and you risk US sanctions; use the US lane and you risk an Iranian attack. Per Kpler, of the ~895 ships that crossed early March to mid-May, just over half took Iran's route and about 40% went by a route nobody can quite place - that 40% is the story. Producers shut in ~11 mbd; Energy Aspects: oil flow recovery will be slow, uneven and possibly incomplete. Gulf producers are even building pipelines to go around Hormuz. The US-Iran interim memo (30-60 days) is in the final stretch, leaving the strait basically under Iranian control however the fees end up dressed. Opening, yes - real. Solved, no.
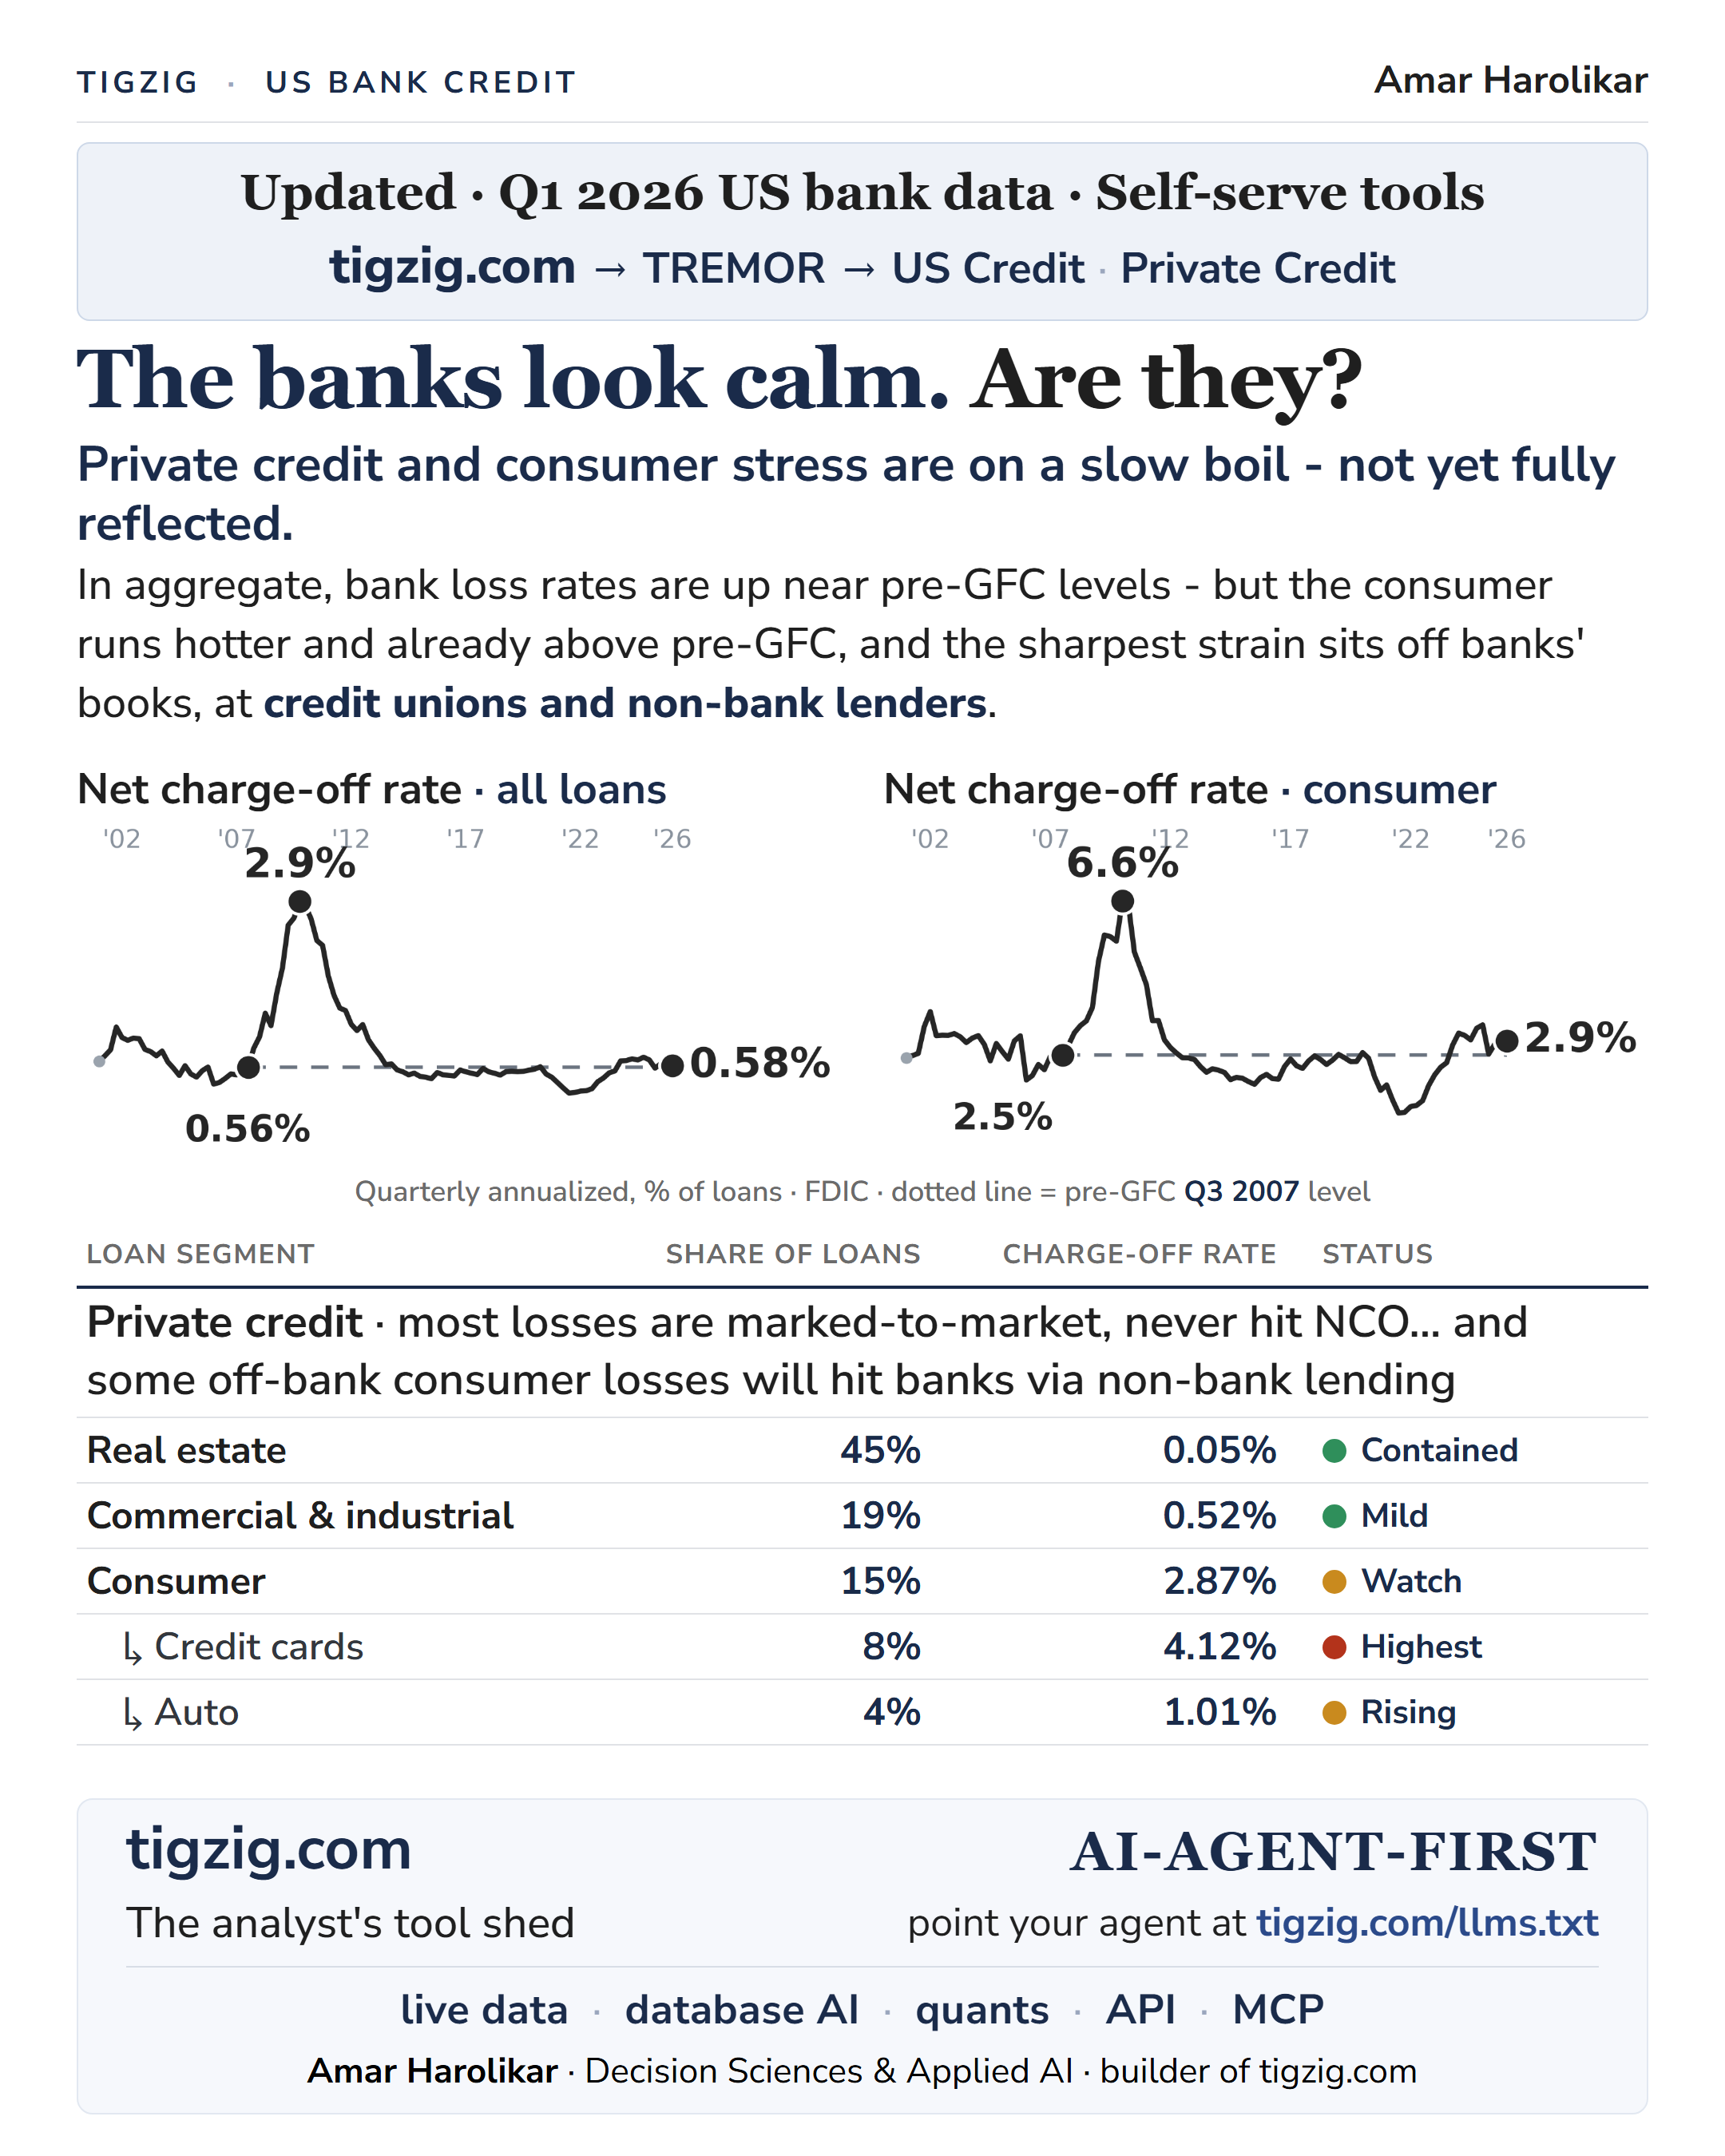
Bank Loss Rates Look Calm. The Stuff Underneath - Consumer, Private Credit, Non-Banks - Says Otherwise.
US bank net charge-offs at 0.58% in Q1 2026 - right at pre-GFC, miles under the GFC peak, so the headline number looks calm. But pull the consumer book out and consumer NCO is already running hotter than pre-GFC at 2.9% vs 2.5% in 2007 - cards highest, auto rising. The sharpest stress sits off the bank books: most private credit losses are marked-to-market and hit P&L directly, never showing as a charge-off. Credit unions and non-bank consumer lenders carry the weakest paper, which loops back to banks via their non-bank and private credit lines. The macro is weak across unemployment, savings rate, producer inflation, oil and gas - all moving the wrong way. The bank NCO looks calm; the stuff it can't show (consumer cards, private credit mark-to-market, non-bank consumer lenders) says otherwise. Analysis supported by TIGZIG TREMOR self-serve analytics tool covering FDIC, NY Fed, NCUA and private-credit series.
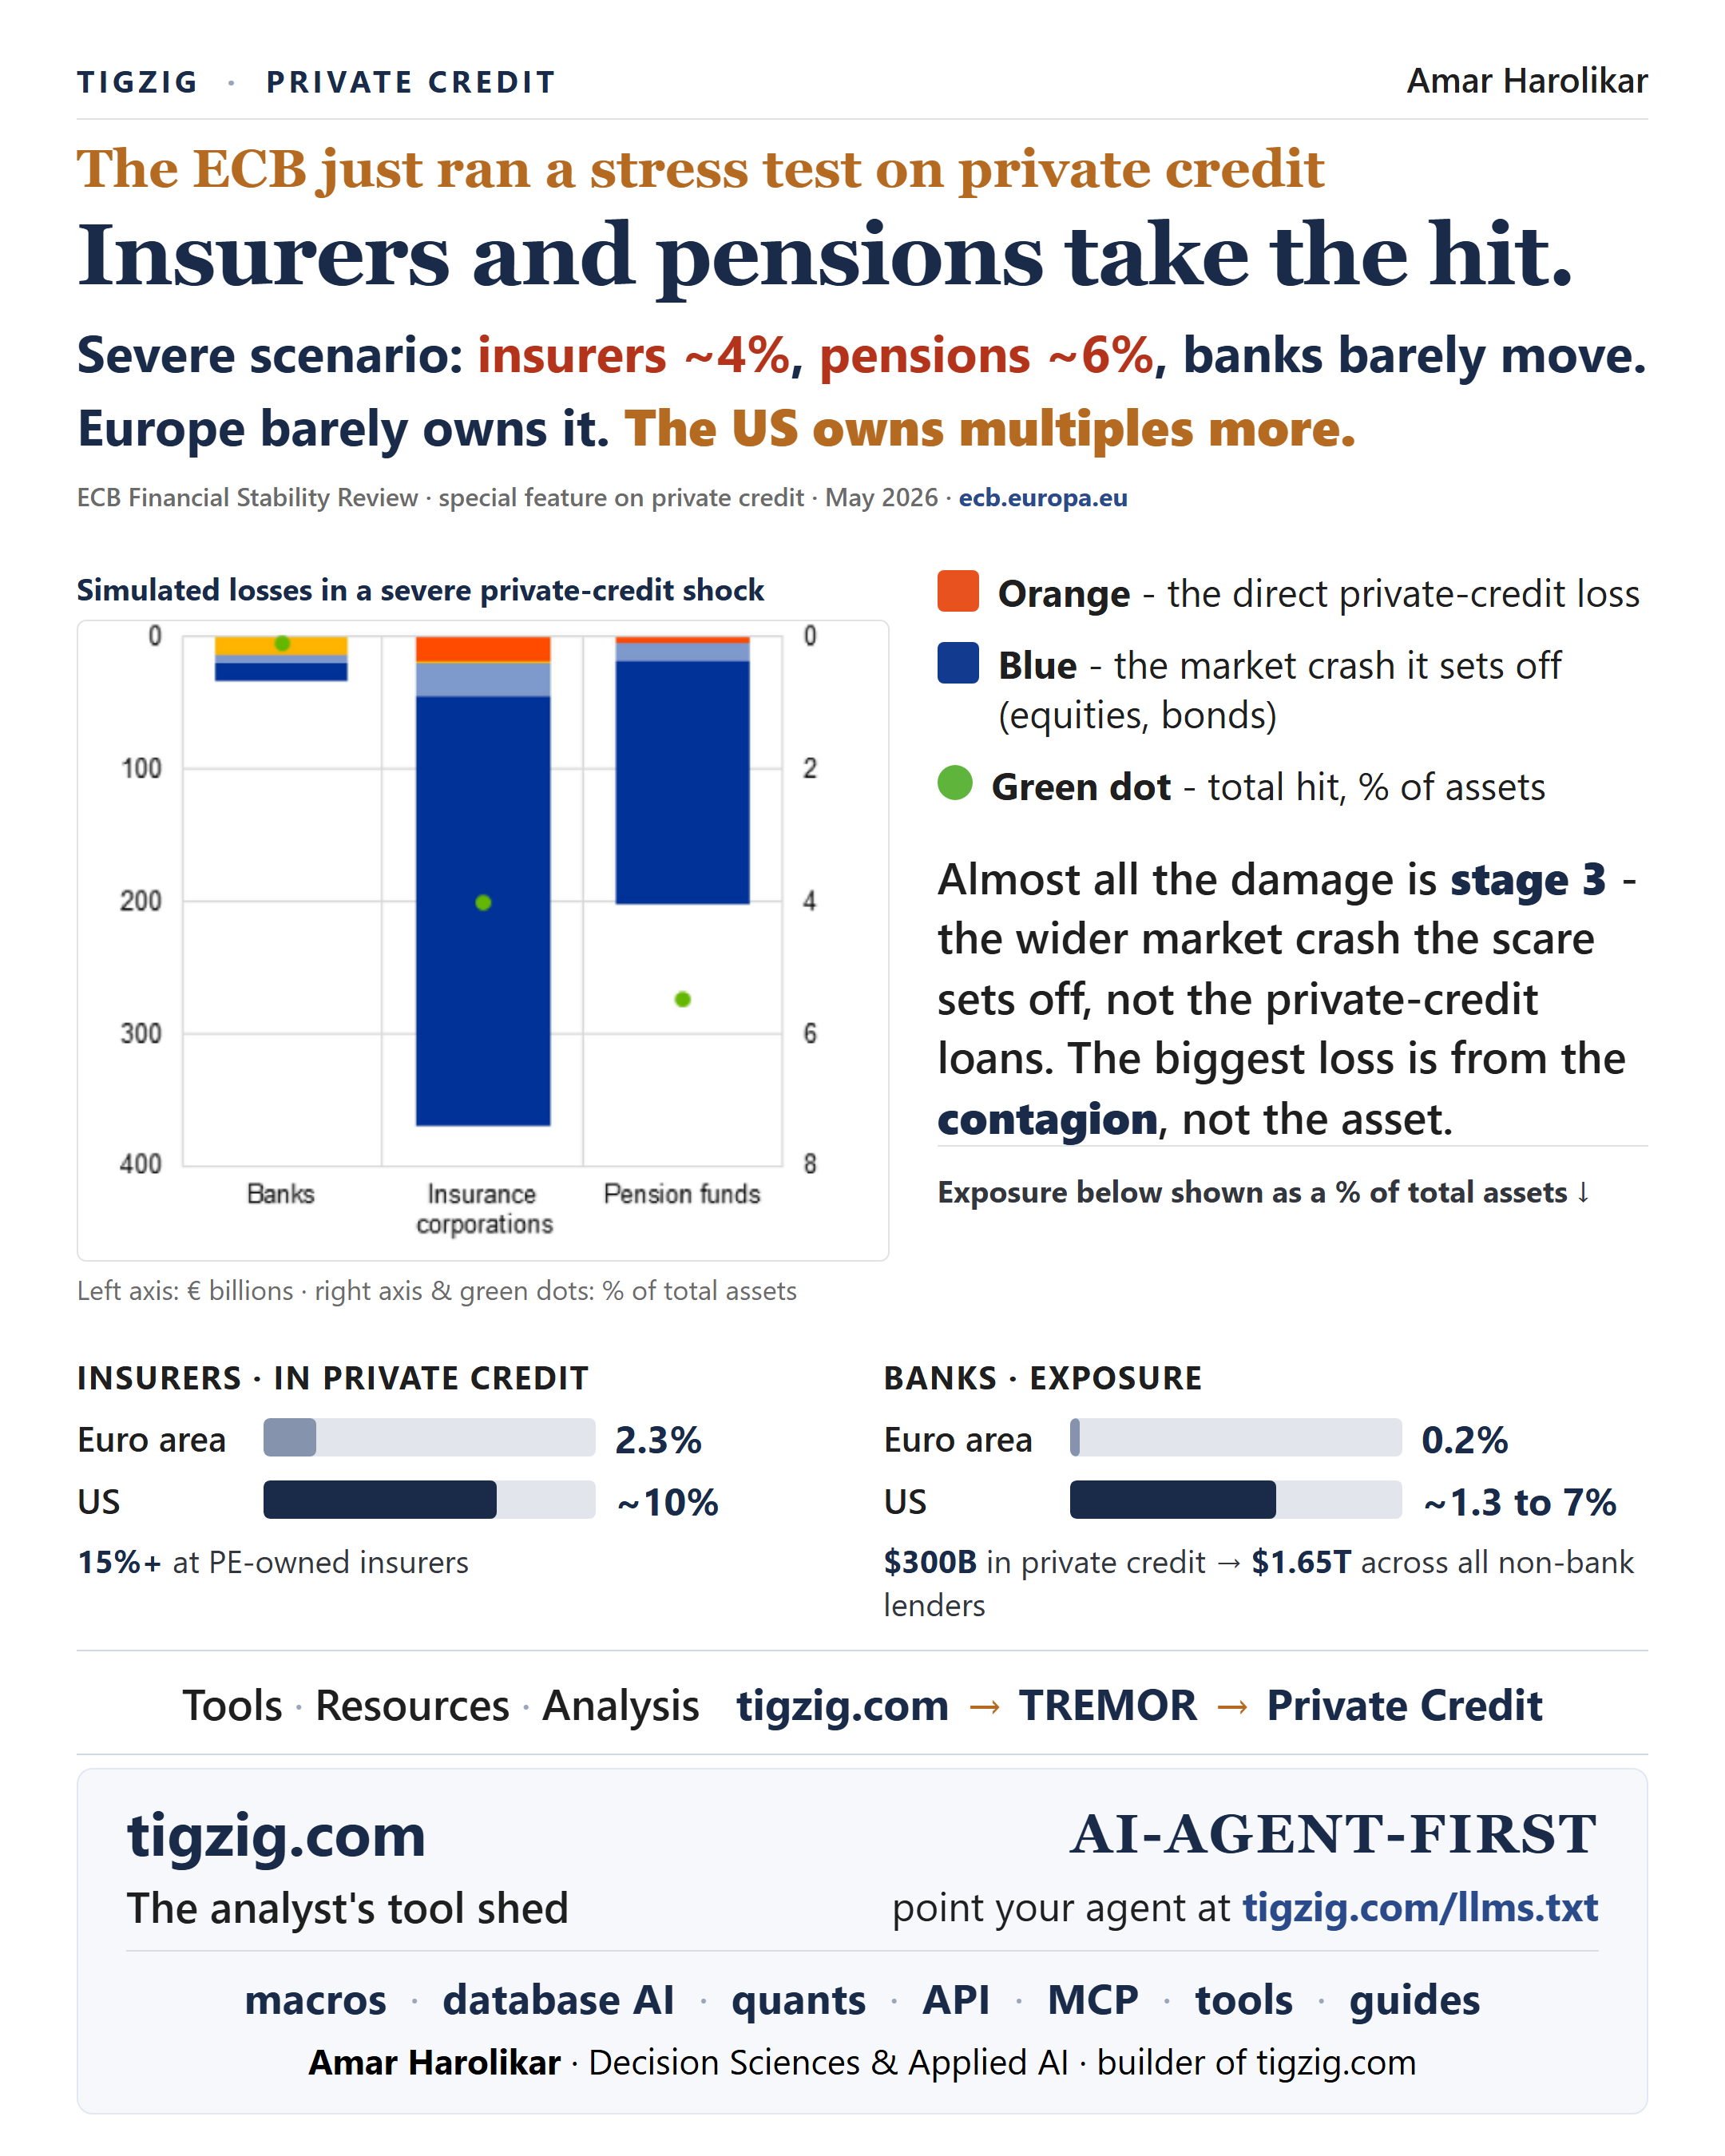
ECB Stress-Tested Private Credit. Pensions Worst at 6% of Assets. Almost All the Damage Is the Wider Market Crash It Sets Off.
The ECB just ran a three-stage stress test on private credit, part of the May 2026 Financial Stability Review special feature. Stage 1: direct private credit losses. Stage 2: contagion to leveraged loans and high-yield bonds. Stage 3: tail scenario (equities -30%, HY repriced -25%, money runs out of private credit funds). Almost all the simulated damage is Stage 3 - the wider market crash the scare sets off, not the loans themselves. Severe-scenario losses: insurance corporations ~4% of assets, pension funds ~6% (the worst-hit), banks barely move. Euro area's direct private credit exposure is tiny (insurers 2.3%, banks 0.2%), but the US owns multiples more - insurers ~10% (15%+ for PE-owned), banks ~1.3-7%, with $300B in private credit and $1.65T in broader non-bank lending. Author commentary: contagion is bigger than the asset (as in prior crises), and given simultaneous global pressures plus the dot-com / GFC playbook, this should not be treated as 'just tail risk' (GFC 2008 was supposed to be tail risk too, until Lehman). ECB report: 'Stress in global private credit markets and its implications for euro area financial stability.'
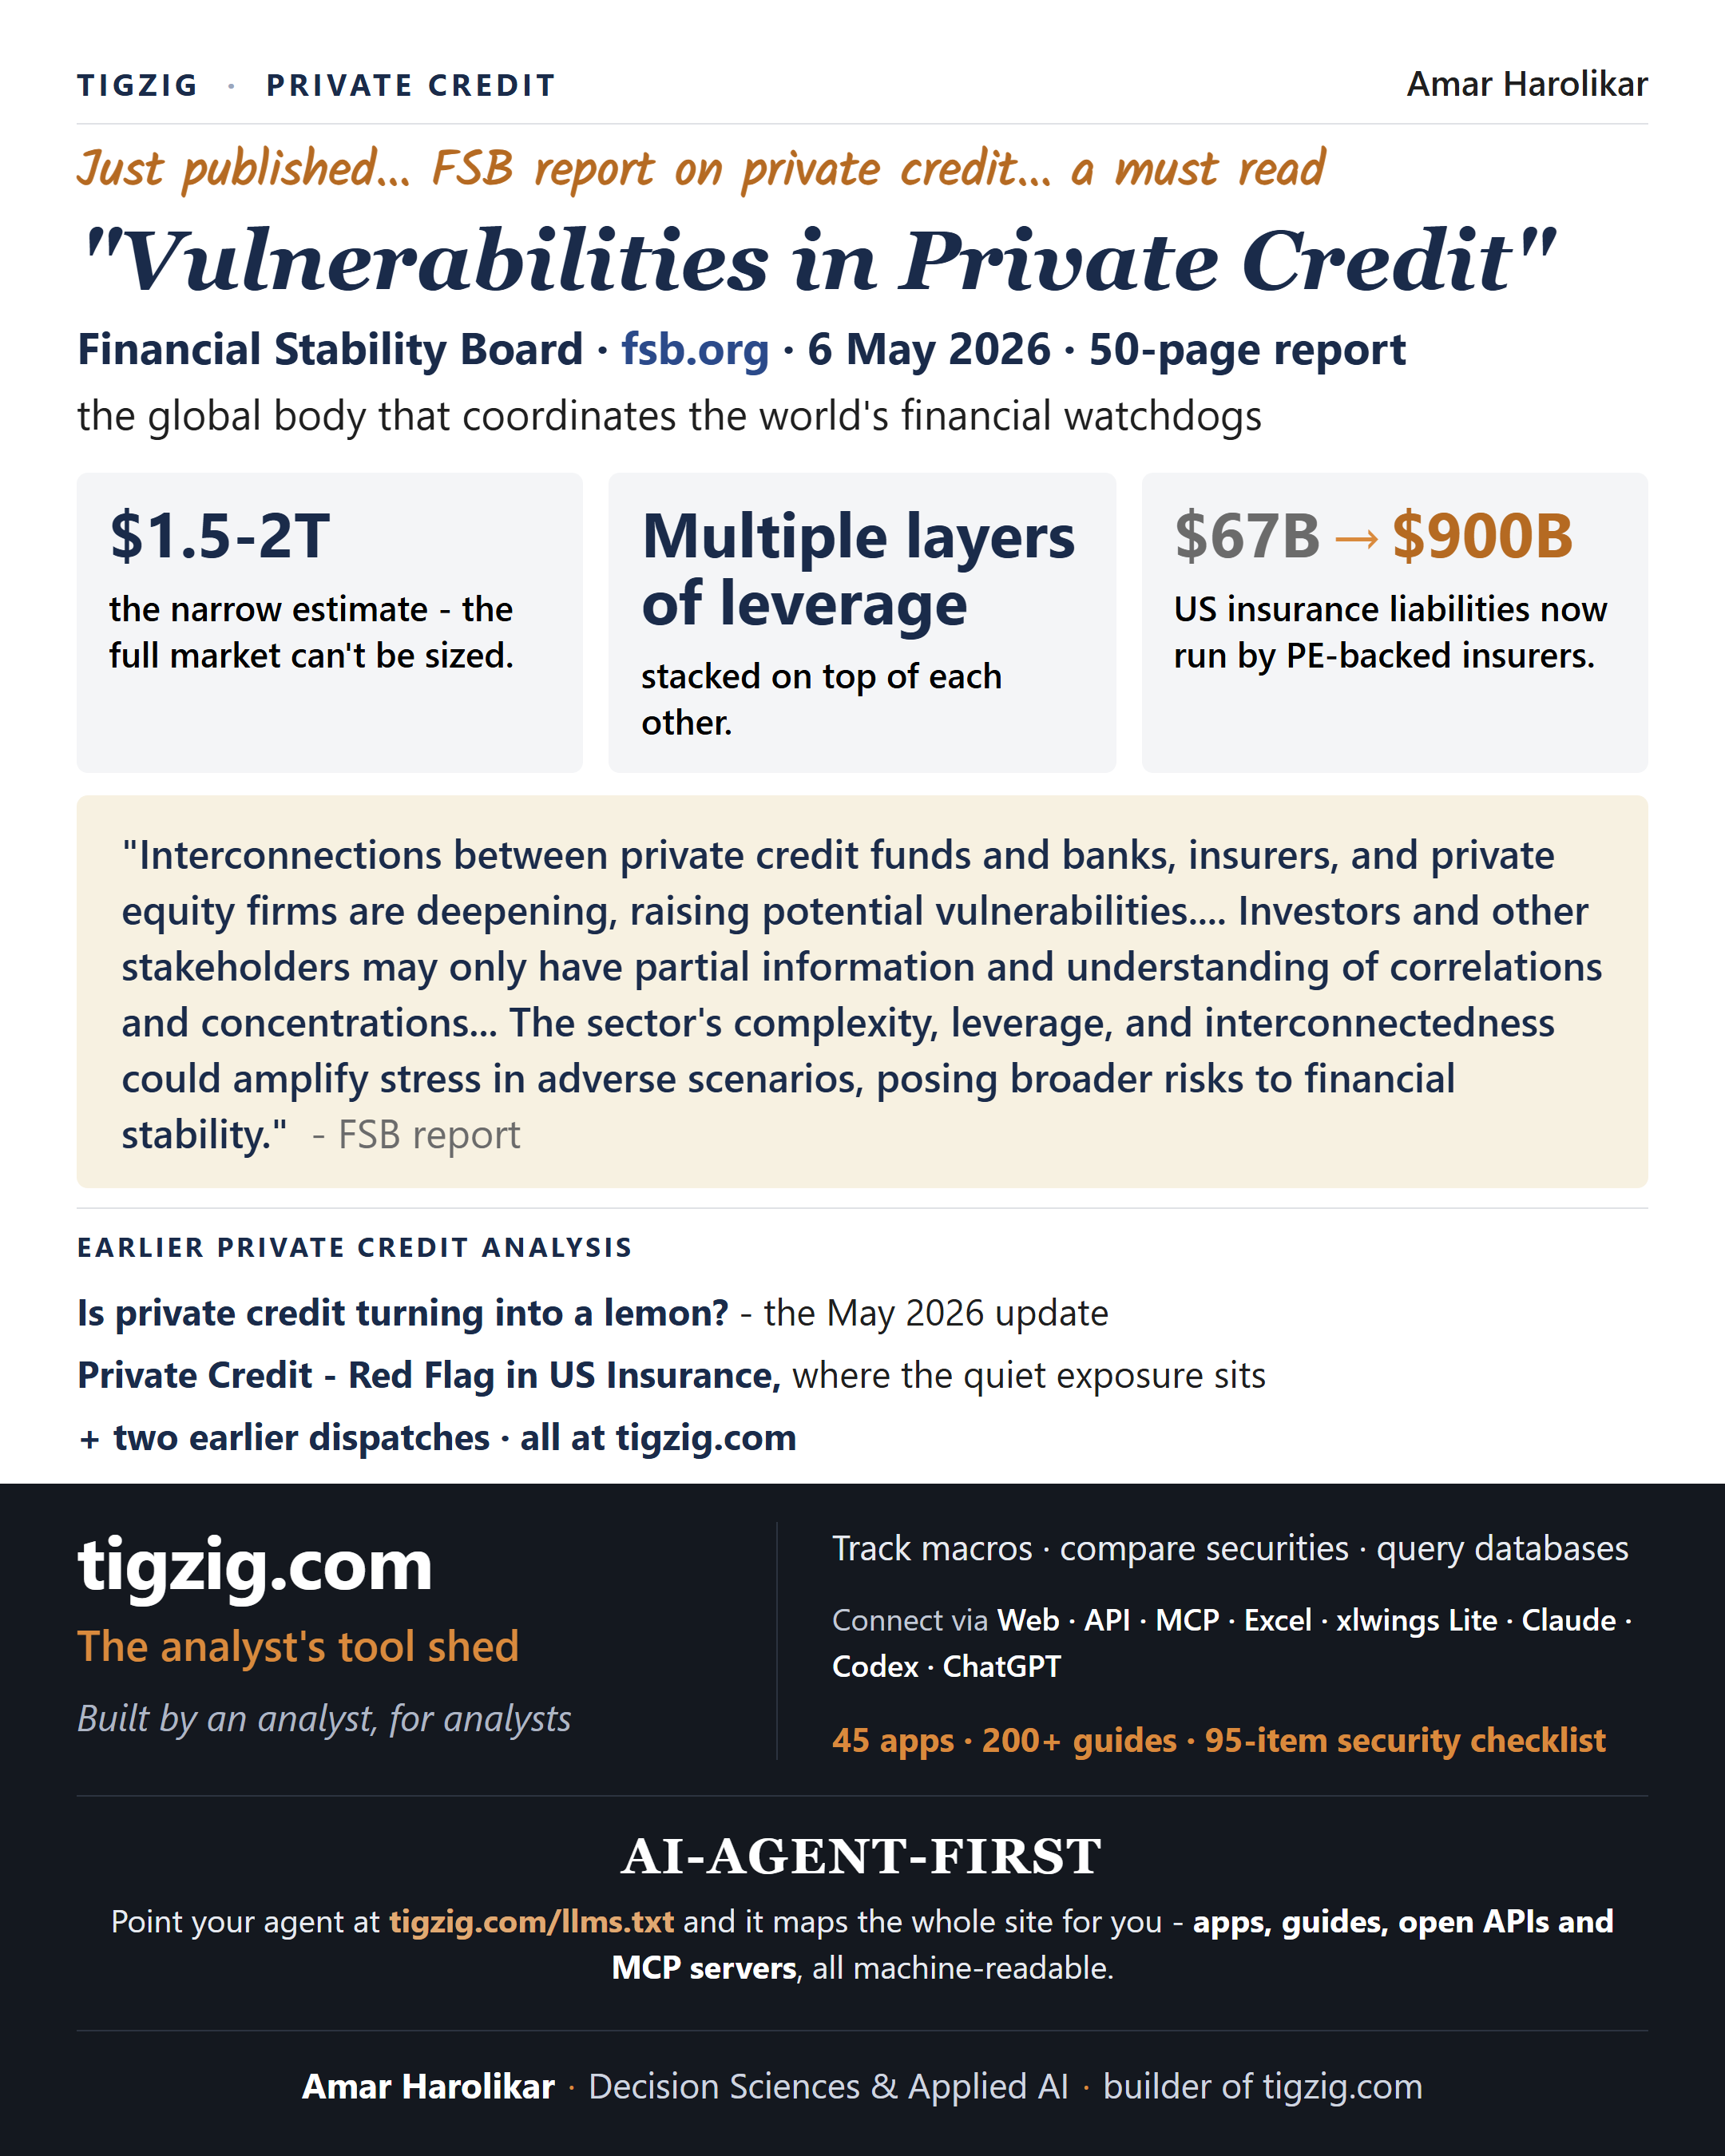
FSB Just Published 50 Pages on Private Credit. The Title: 'Vulnerabilities in Private Credit.' Worth Reading.
The Financial Stability Board's 6 May 2026 report 'Vulnerabilities in Private Credit' - 50 pages. The body that coordinates the Fed, ECB, BoE and the world's other financial regulators putting on the record what they're collectively worried about - layered leverage, opaque valuations, PE-owned insurers, interconnections and instrument risks that aren't fully understood, with a potential for systemic risk to the financial system in stress scenarios. One-pager highlights: market sizing $1.5-2T narrow estimate (full market can't be sized); multiple layers of leverage stacked on top of each other; US insurance liabilities run by PE-backed insurers grown from $67B to $900B. FSB quote: 'interconnections between private credit funds and banks, insurers, and private equity firms are deepening, raising potential vulnerabilities... investors and other stakeholders may only have partial information and understanding of correlations and concentrations... the sector's complexity, leverage, and interconnectedness could amplify stress in adverse scenarios, posing broader risks to financial stability.' Continues the Tigzig private-credit dispatch series (4 prior pieces).
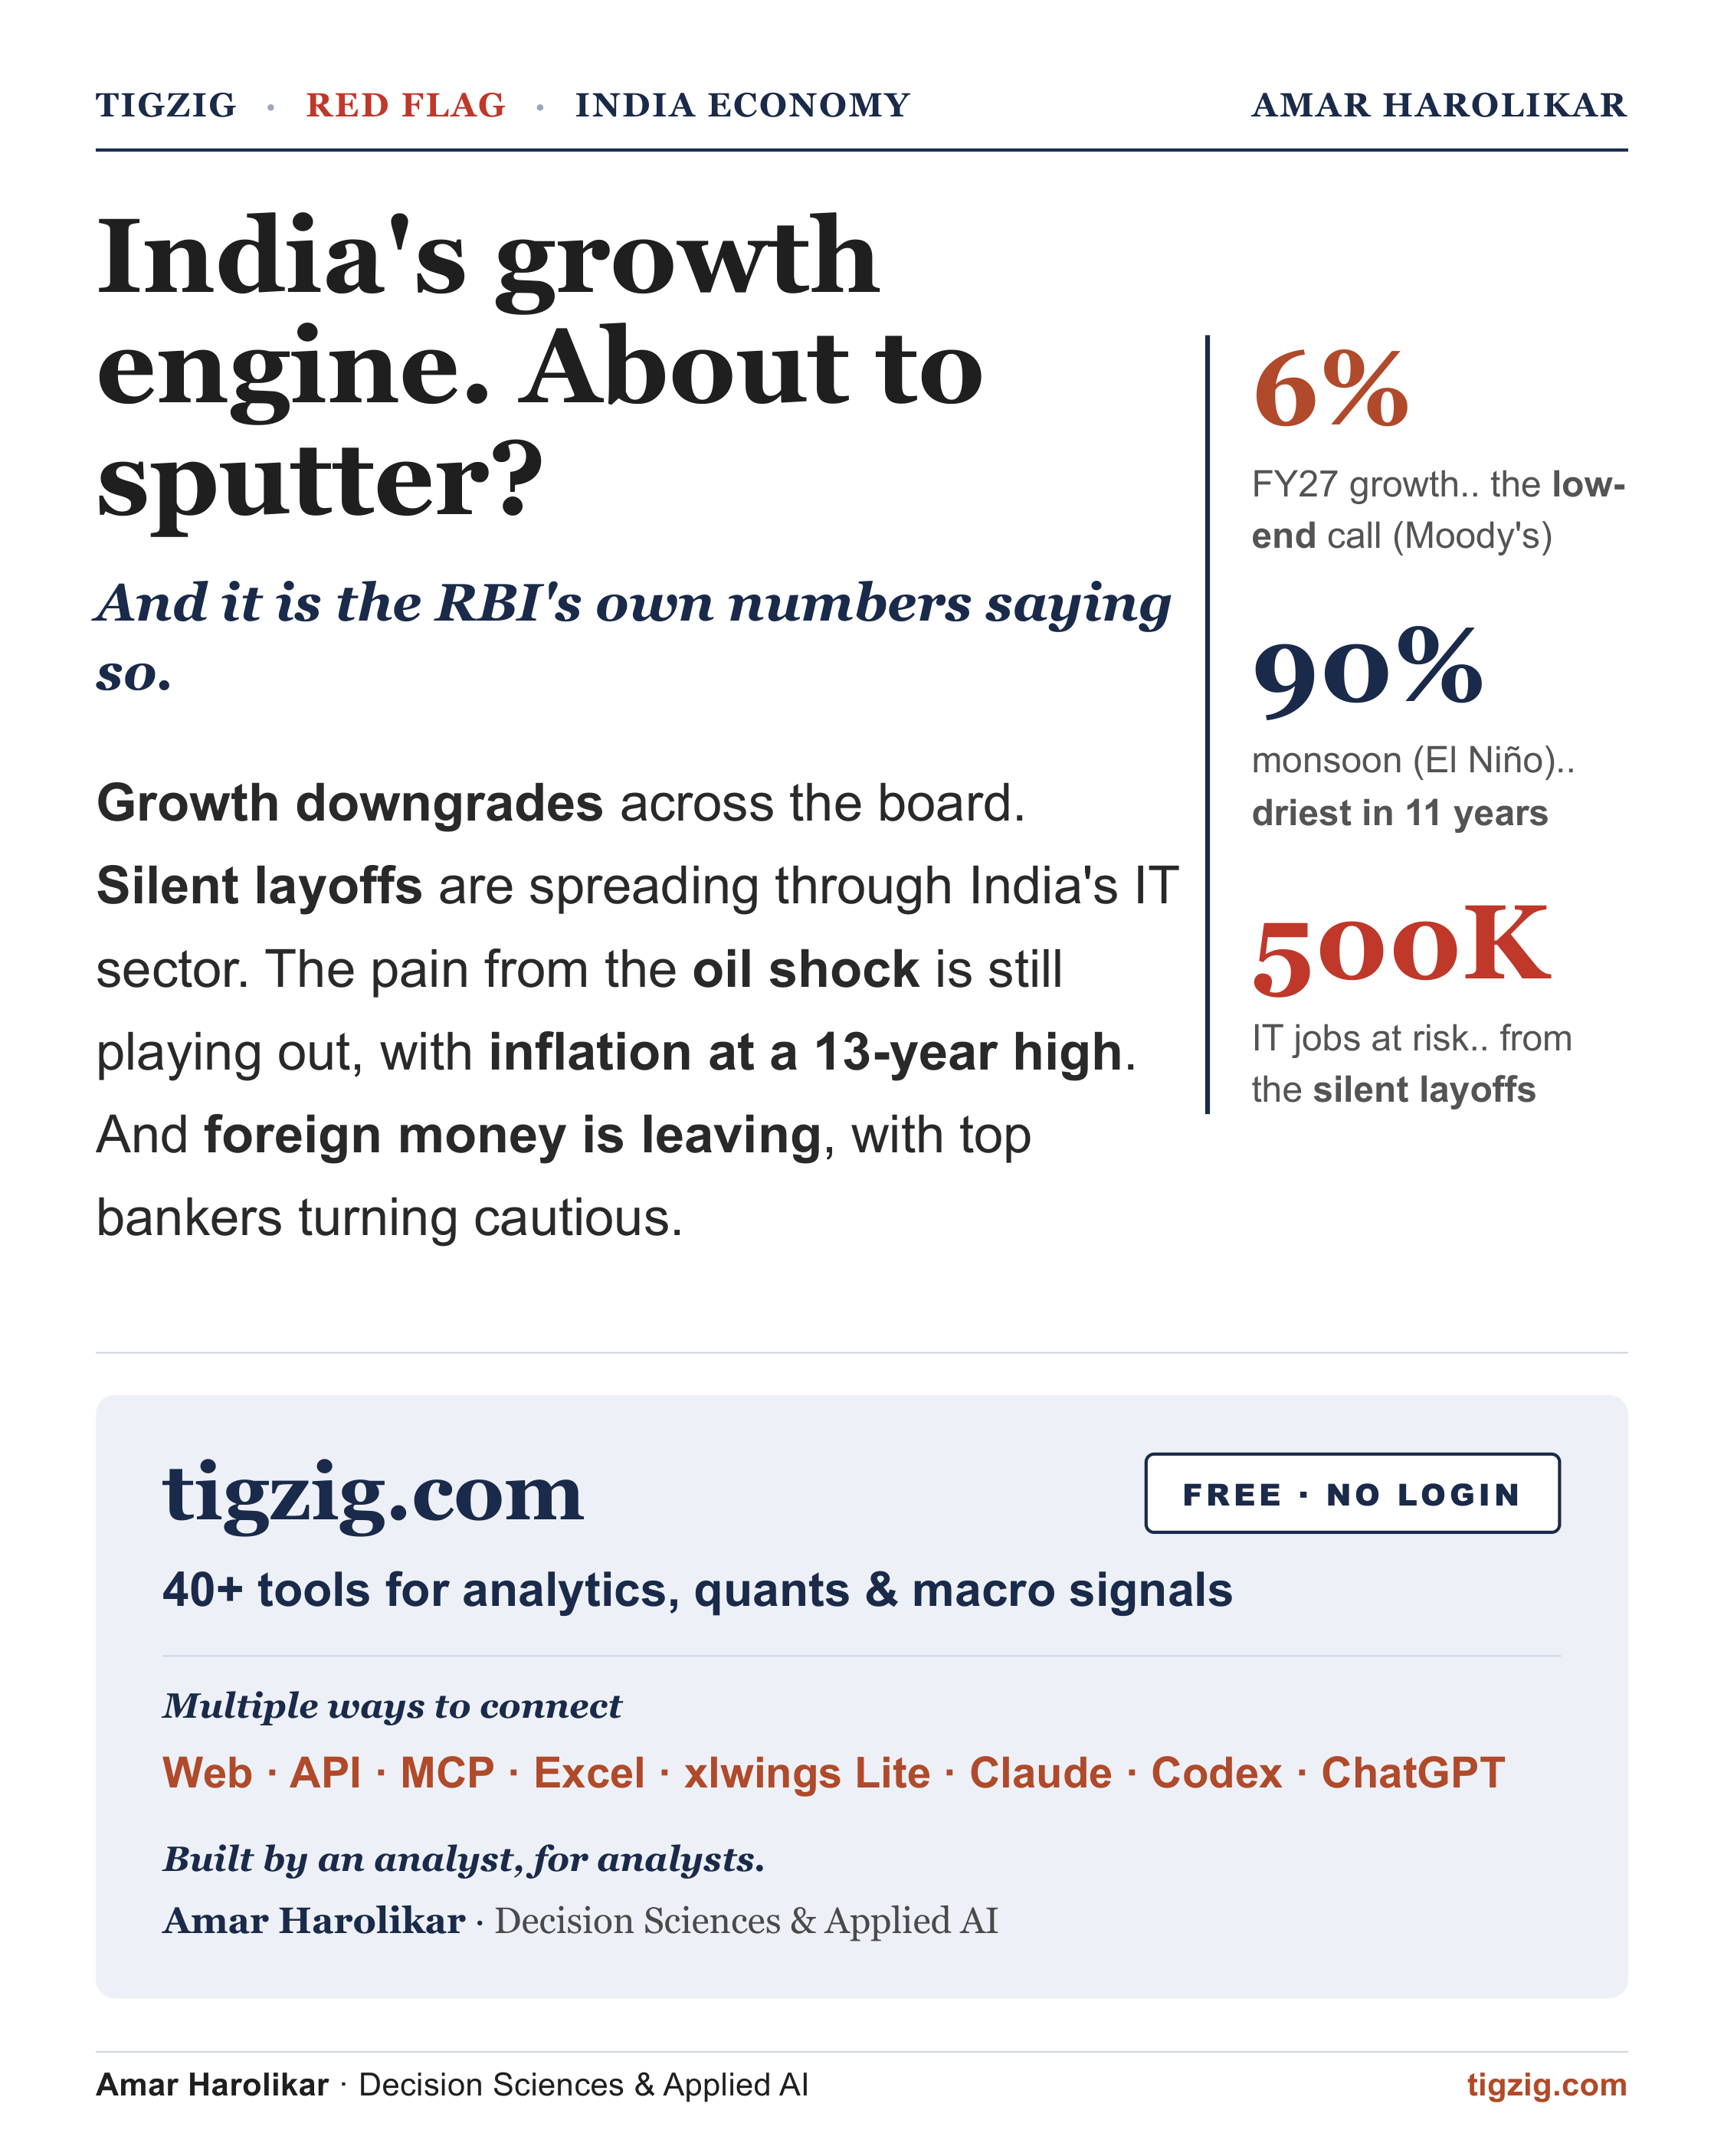
India Was the Market's Darling. Not Any More. The Growth Story Has a Big Red Flag.
13-slide deep dive on the India macro red-flag stack as of May 2026. GDP forecast trims across the board - Moody's FY27 at 6% (the low-end call), S&P 6.6% (from 7.1%), ICRA 6.2% (from 6.5%). IT sector silent layoffs - TCS ~12,000 cut, ~50,000 IT jobs going this year, ~500,000 at risk over 2-3 years, with the model itself being questioned as AI replaces offshore engineering work. Foreign portfolio investors net seller (FY26 net exit, BofA expecting selloff into 2027/2028); FDI anchor held at +$7.7B. Wholesale Price Index at a 13-year high (ex-Covid spike); the WPI-CPI lag means retail catch-up is the base case. Record merchandise trade deficit of -$333B (FY26) on flat exports (+0.9%) and rising imports (+7.6%); China overtakes US as India's largest trading partner. Oil shock still playing out - four fuel hikes in two weeks, Delhi petrol Rs 102, OMC losses ~Rs 30,000 crore/month per ICRA. IMD El Niño monsoon forecast at 90% of LPA - driest in 11 years - which none of the GDP downgrades have priced in. Bankers warning publicly (Uday Kotak at CII: 'it's coming, and it's coming big'); PM appealing for fuel austerity. For India, anything below 4-5% GDP growth is recession territory. Any one is manageable. All of them at once is the problem. Silver lining: the India AI data-centre buildout (Adani, Reliance, Bharti) - covered in the prior India's Next Tech Wave dispatch.
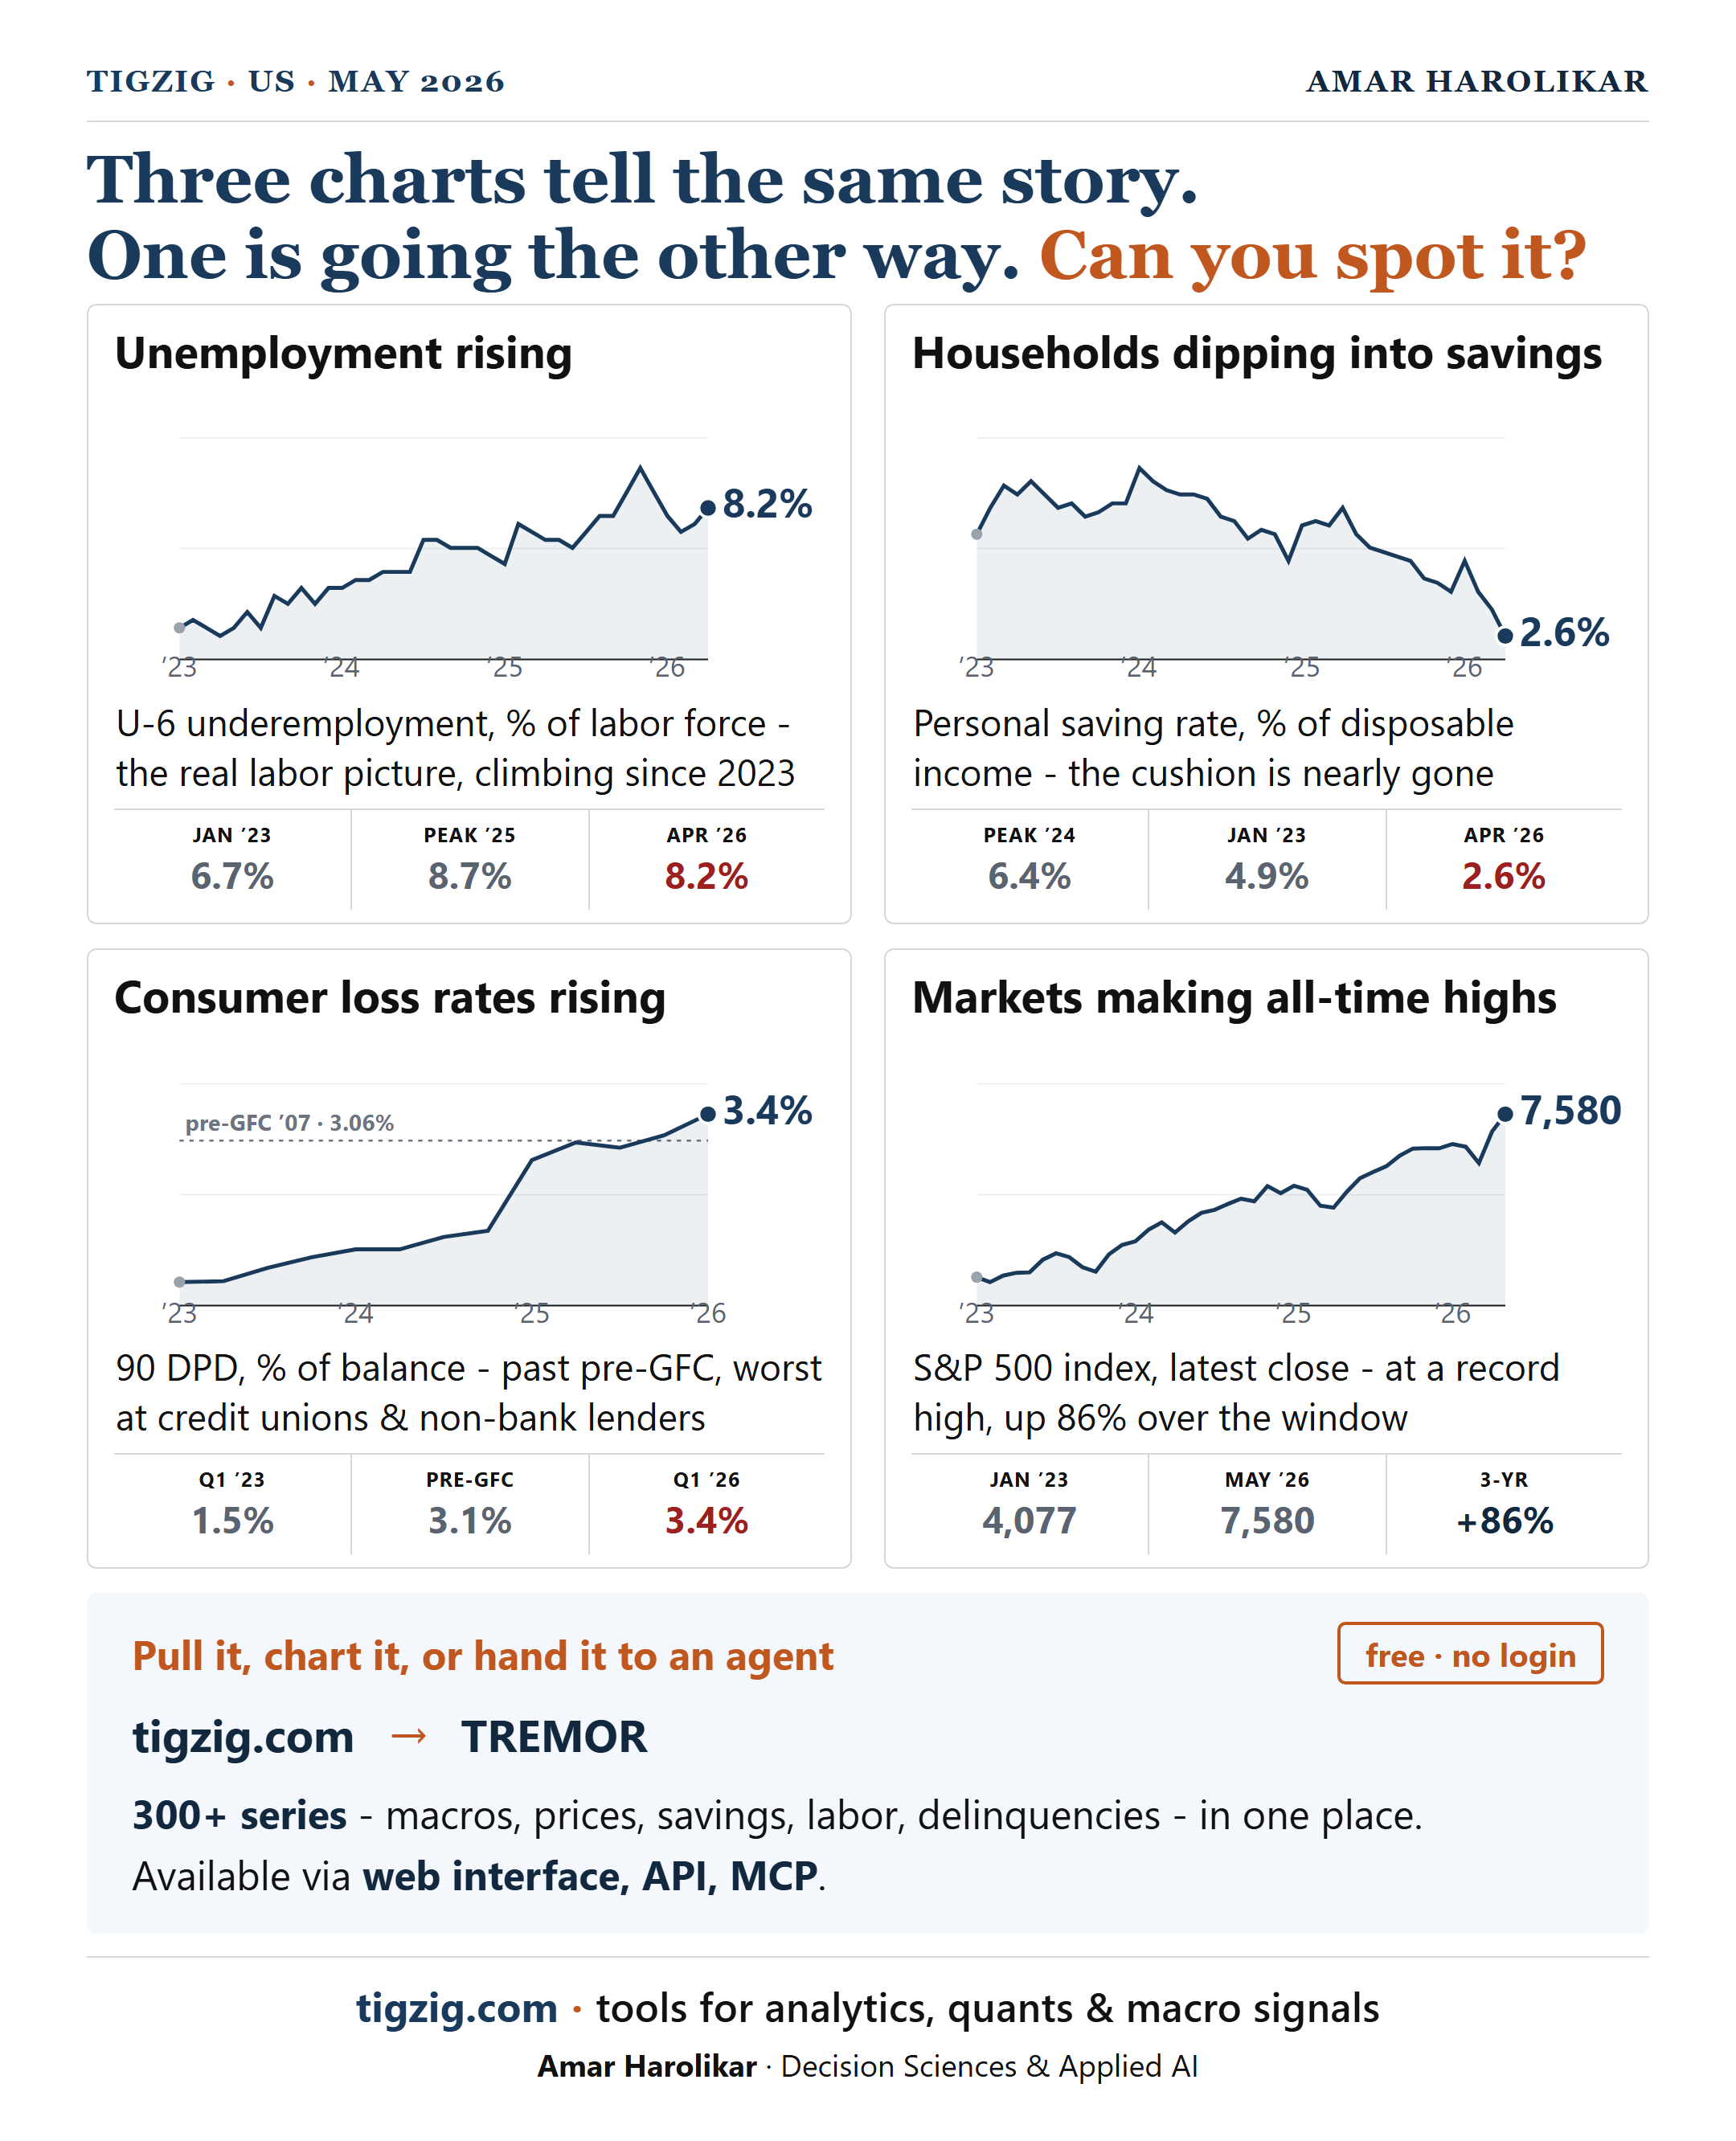
Which Chart Is the Odd One Out? Three Macro Charts Tell the Same Story. One Doesn't.
Four-chart US macro one-pager (May 2026) asking the spot-the-odd-one-out question. Three charts show rising stress - U-6 underemployment at 8.2% (climbing since 2023, up from 6.7% Jan 2023 and past 8.7% Peak 2025), personal saving rate down to 2.6% (from 6.4% peak 2024 and 4.9% Jan 2023, the cushion is nearly gone), consumer 90 DPD loss rate at 3.4% (past the pre-GFC 3.06% reference, worst at credit unions and non-bank lenders). The fourth chart: S&P 500 at a record 7,580, up 86% over the three-year window. Three macro-stress charts in one direction; the index chart in the other. Tools that drive this kind of comparison are on tigzig.com - free, no login, 300+ series covering macros, prices, savings, labor and delinquencies, available via web interface, API or MCP for AI agents.
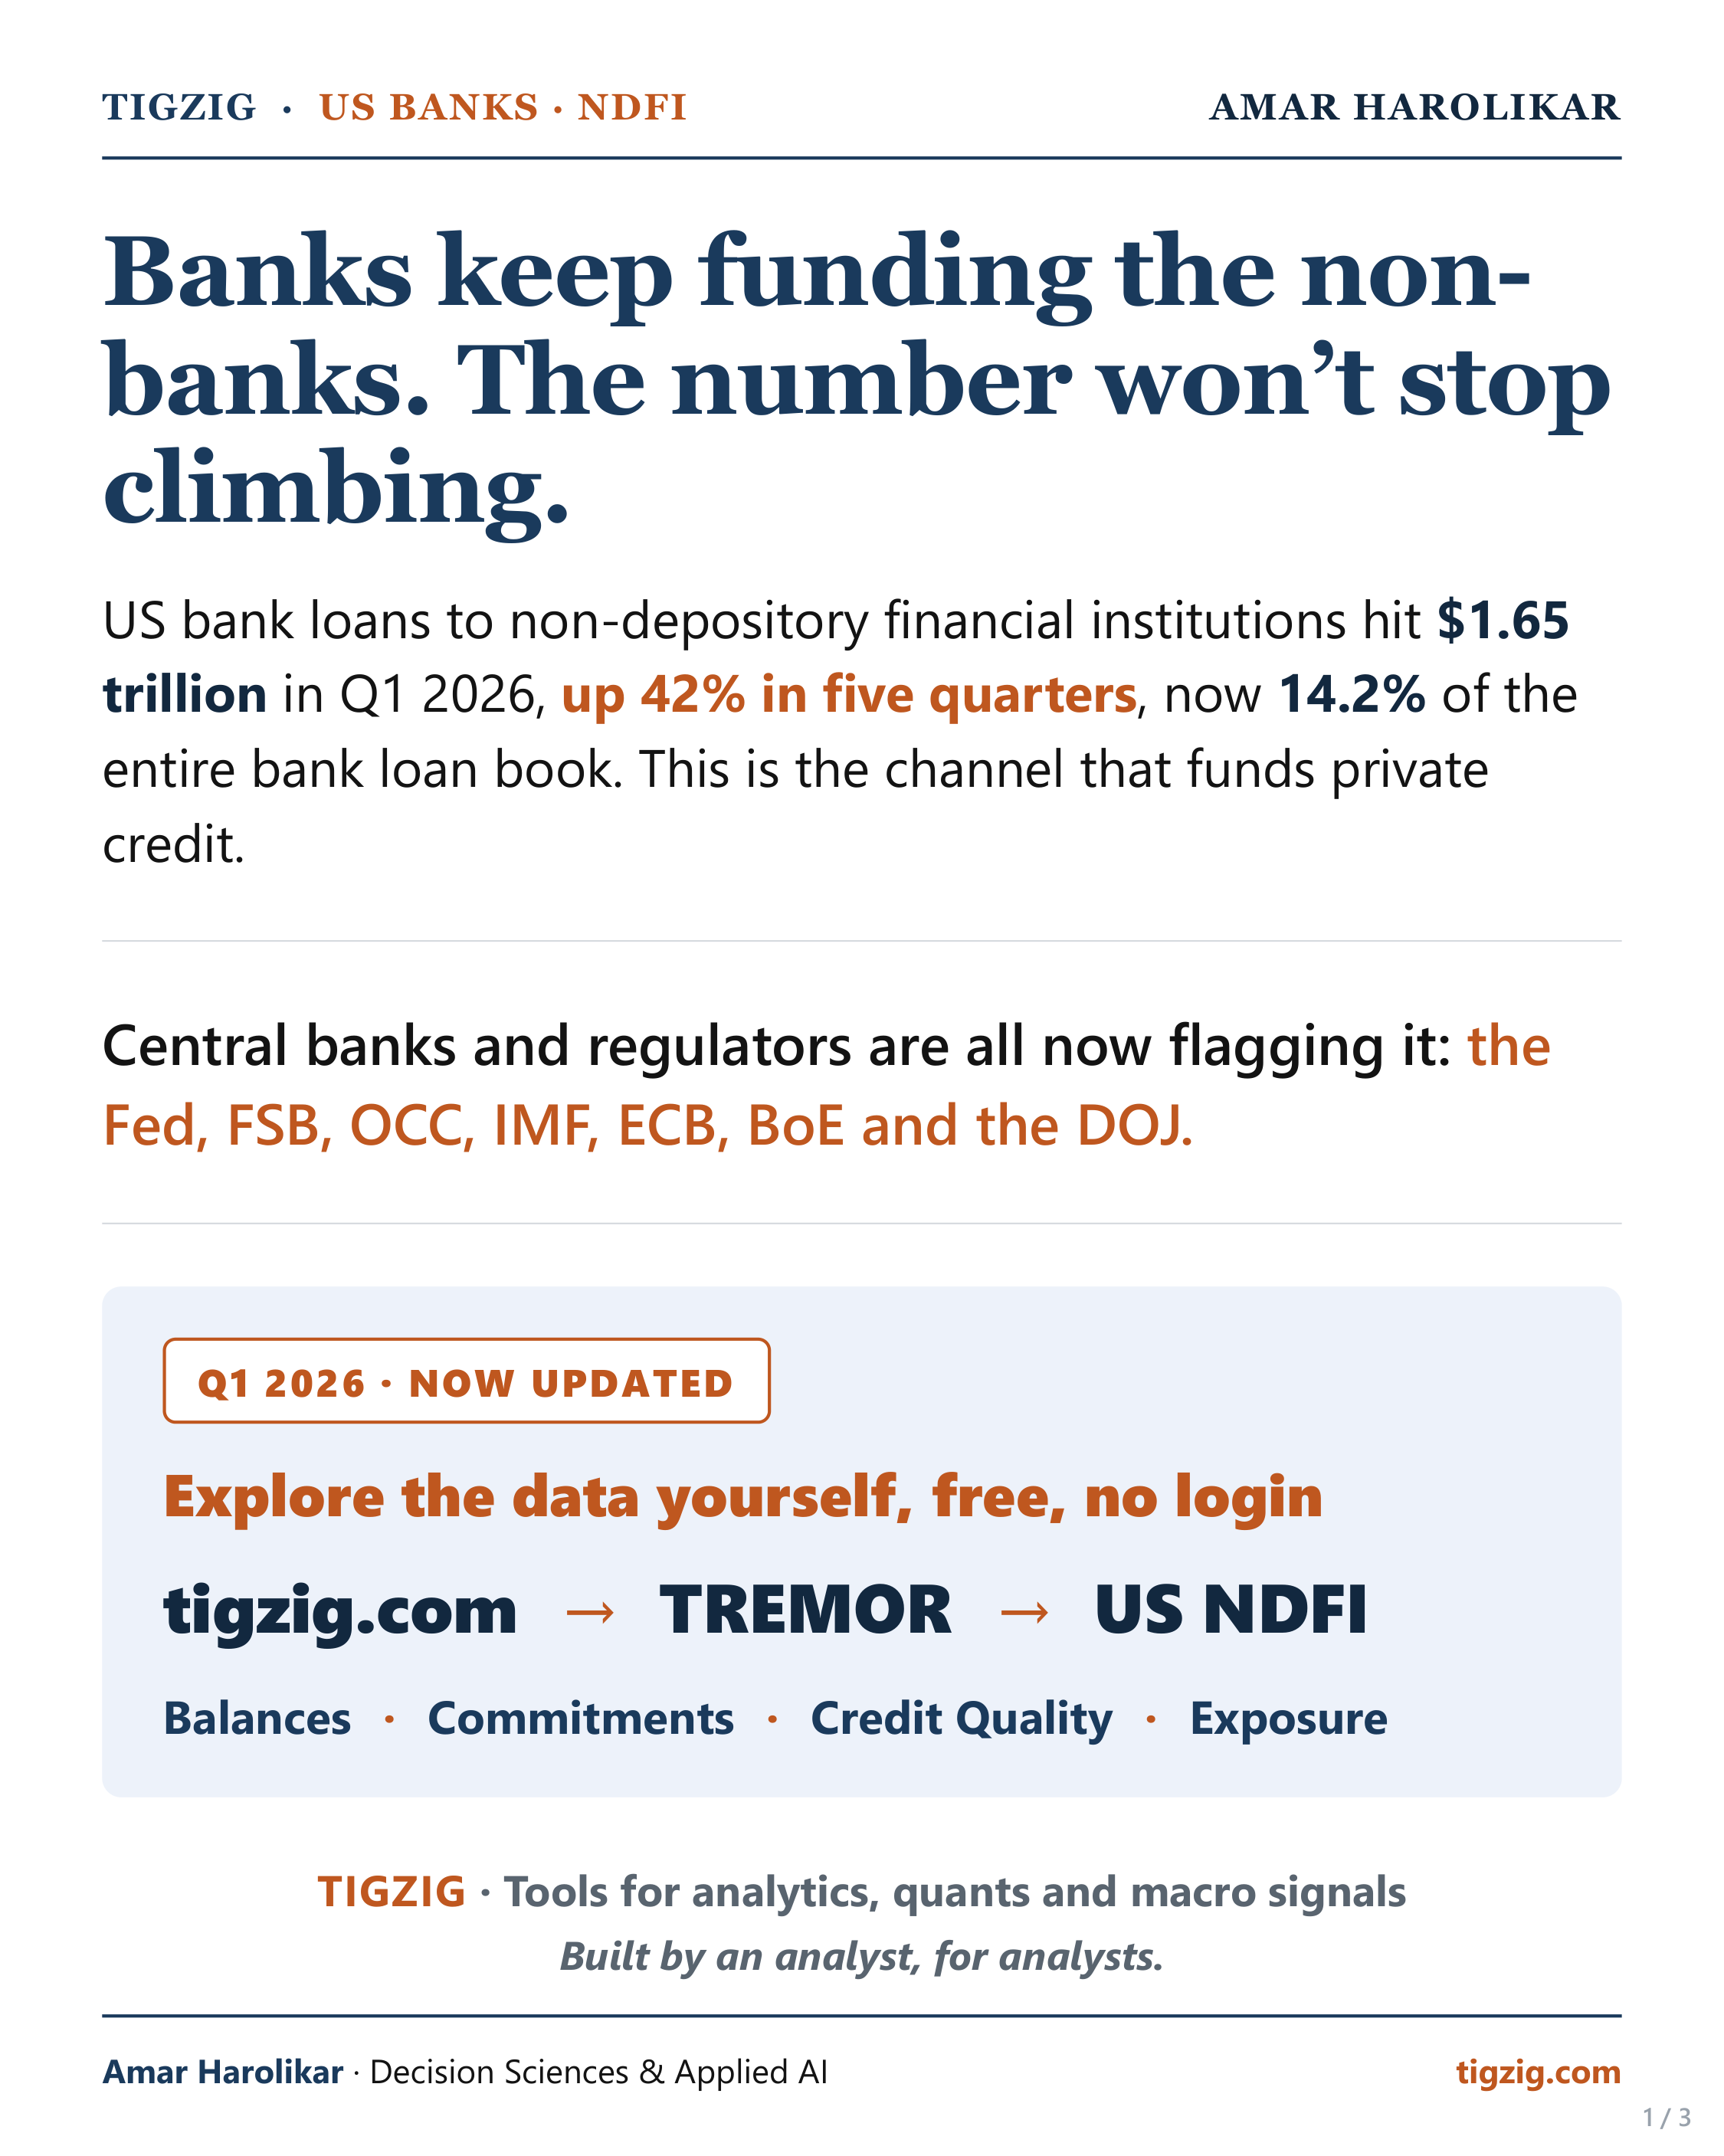
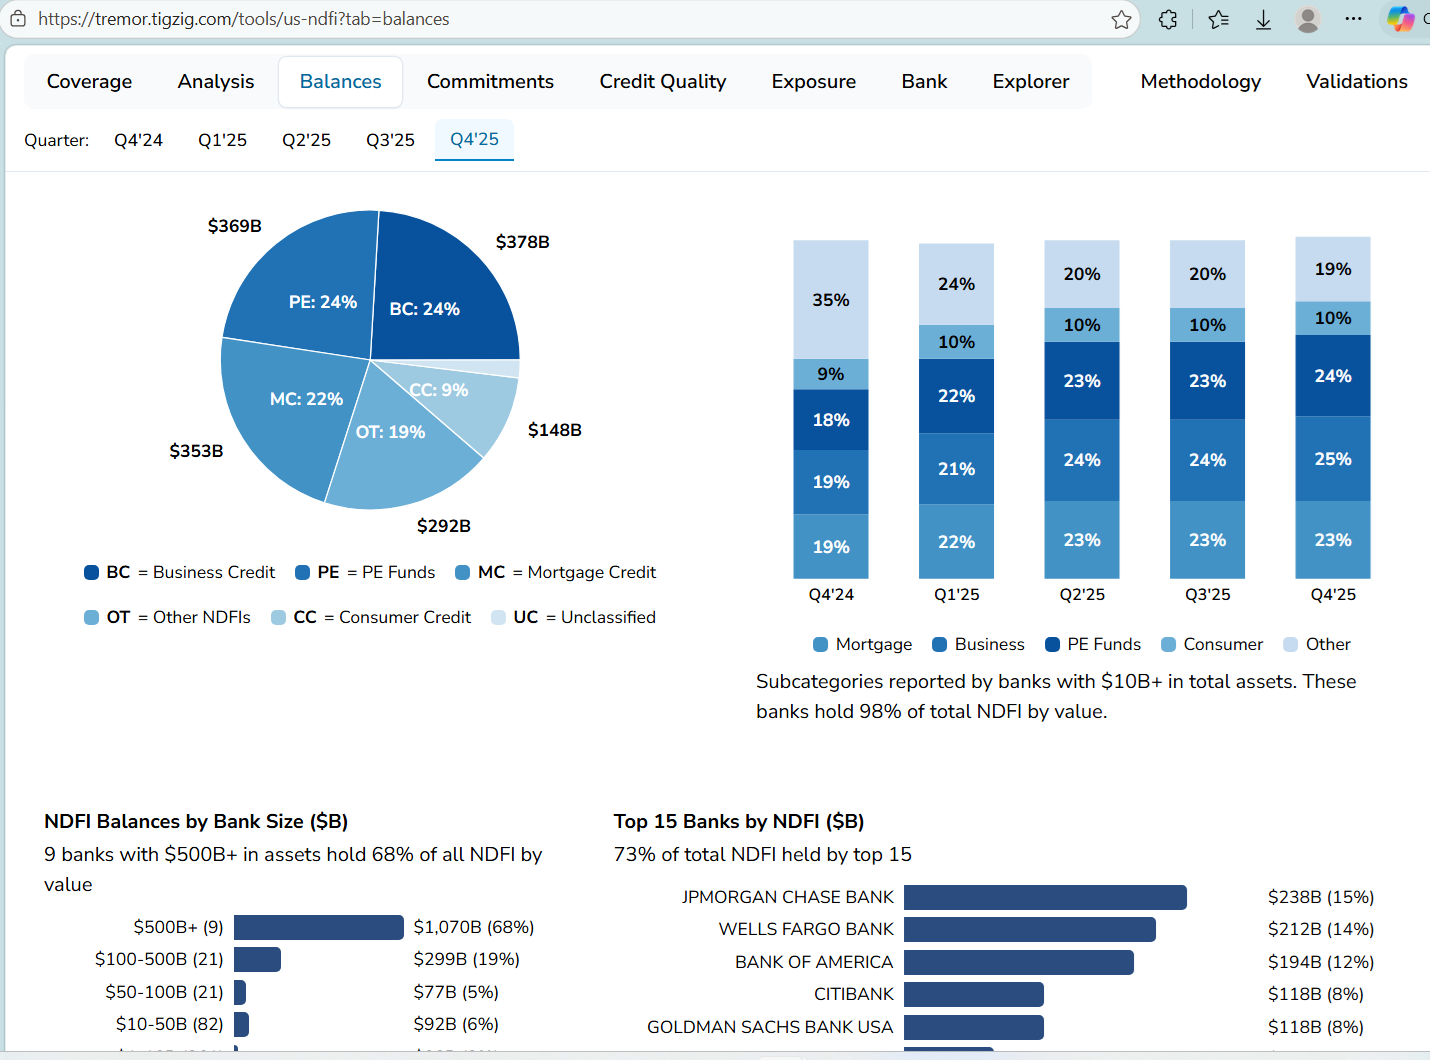
Banks Keep Funding the Non-Banks. $1.65T in Q1 2026, Up 42% in Five Quarters. US Banks NDFI Update.
Q1 2026 update on US bank lending to non-depository financial institutions (NDFI) - the channel funding private credit. Balances hit $1.65T, up 42% in five quarters and now 14.2% of the entire bank loan book (up from 11.1%) or 7.1% of total assets (up from 5.6%). 622 banks. Top 10 hold 73% of all NDFI loans. Subcategory mix: Business Credit $435B (26%), PE Funds $383B (23%), Mortgage Credit $368B (22%), Other NDFIs $269B (16%), Consumer Credit $166B (10%). Top lenders: JPMorgan $238B, Wells Fargo $228B, Bank of America $213B, Goldman $123B, Citi $123B. Add undrawn commitments of $1.06T and total exposure hits $2.7T. The Fed, FSB, OCC, IMF, ECB, BoE and DOJ all flagging it; Fitch private-credit default rate at a record 6.0%; Bank of England calling it a 'market for lemons'. Tool live at tigzig.com/tools/us-ndfi (TREMOR) with bank-level balances, commitments, credit quality and exposure - free, no login, sourced directly from quarterly FFIEC Call Reports (Schedule RC-C). Continues the four-dispatch private-credit series (Mar 24, Mar 26, May 8, May 28).
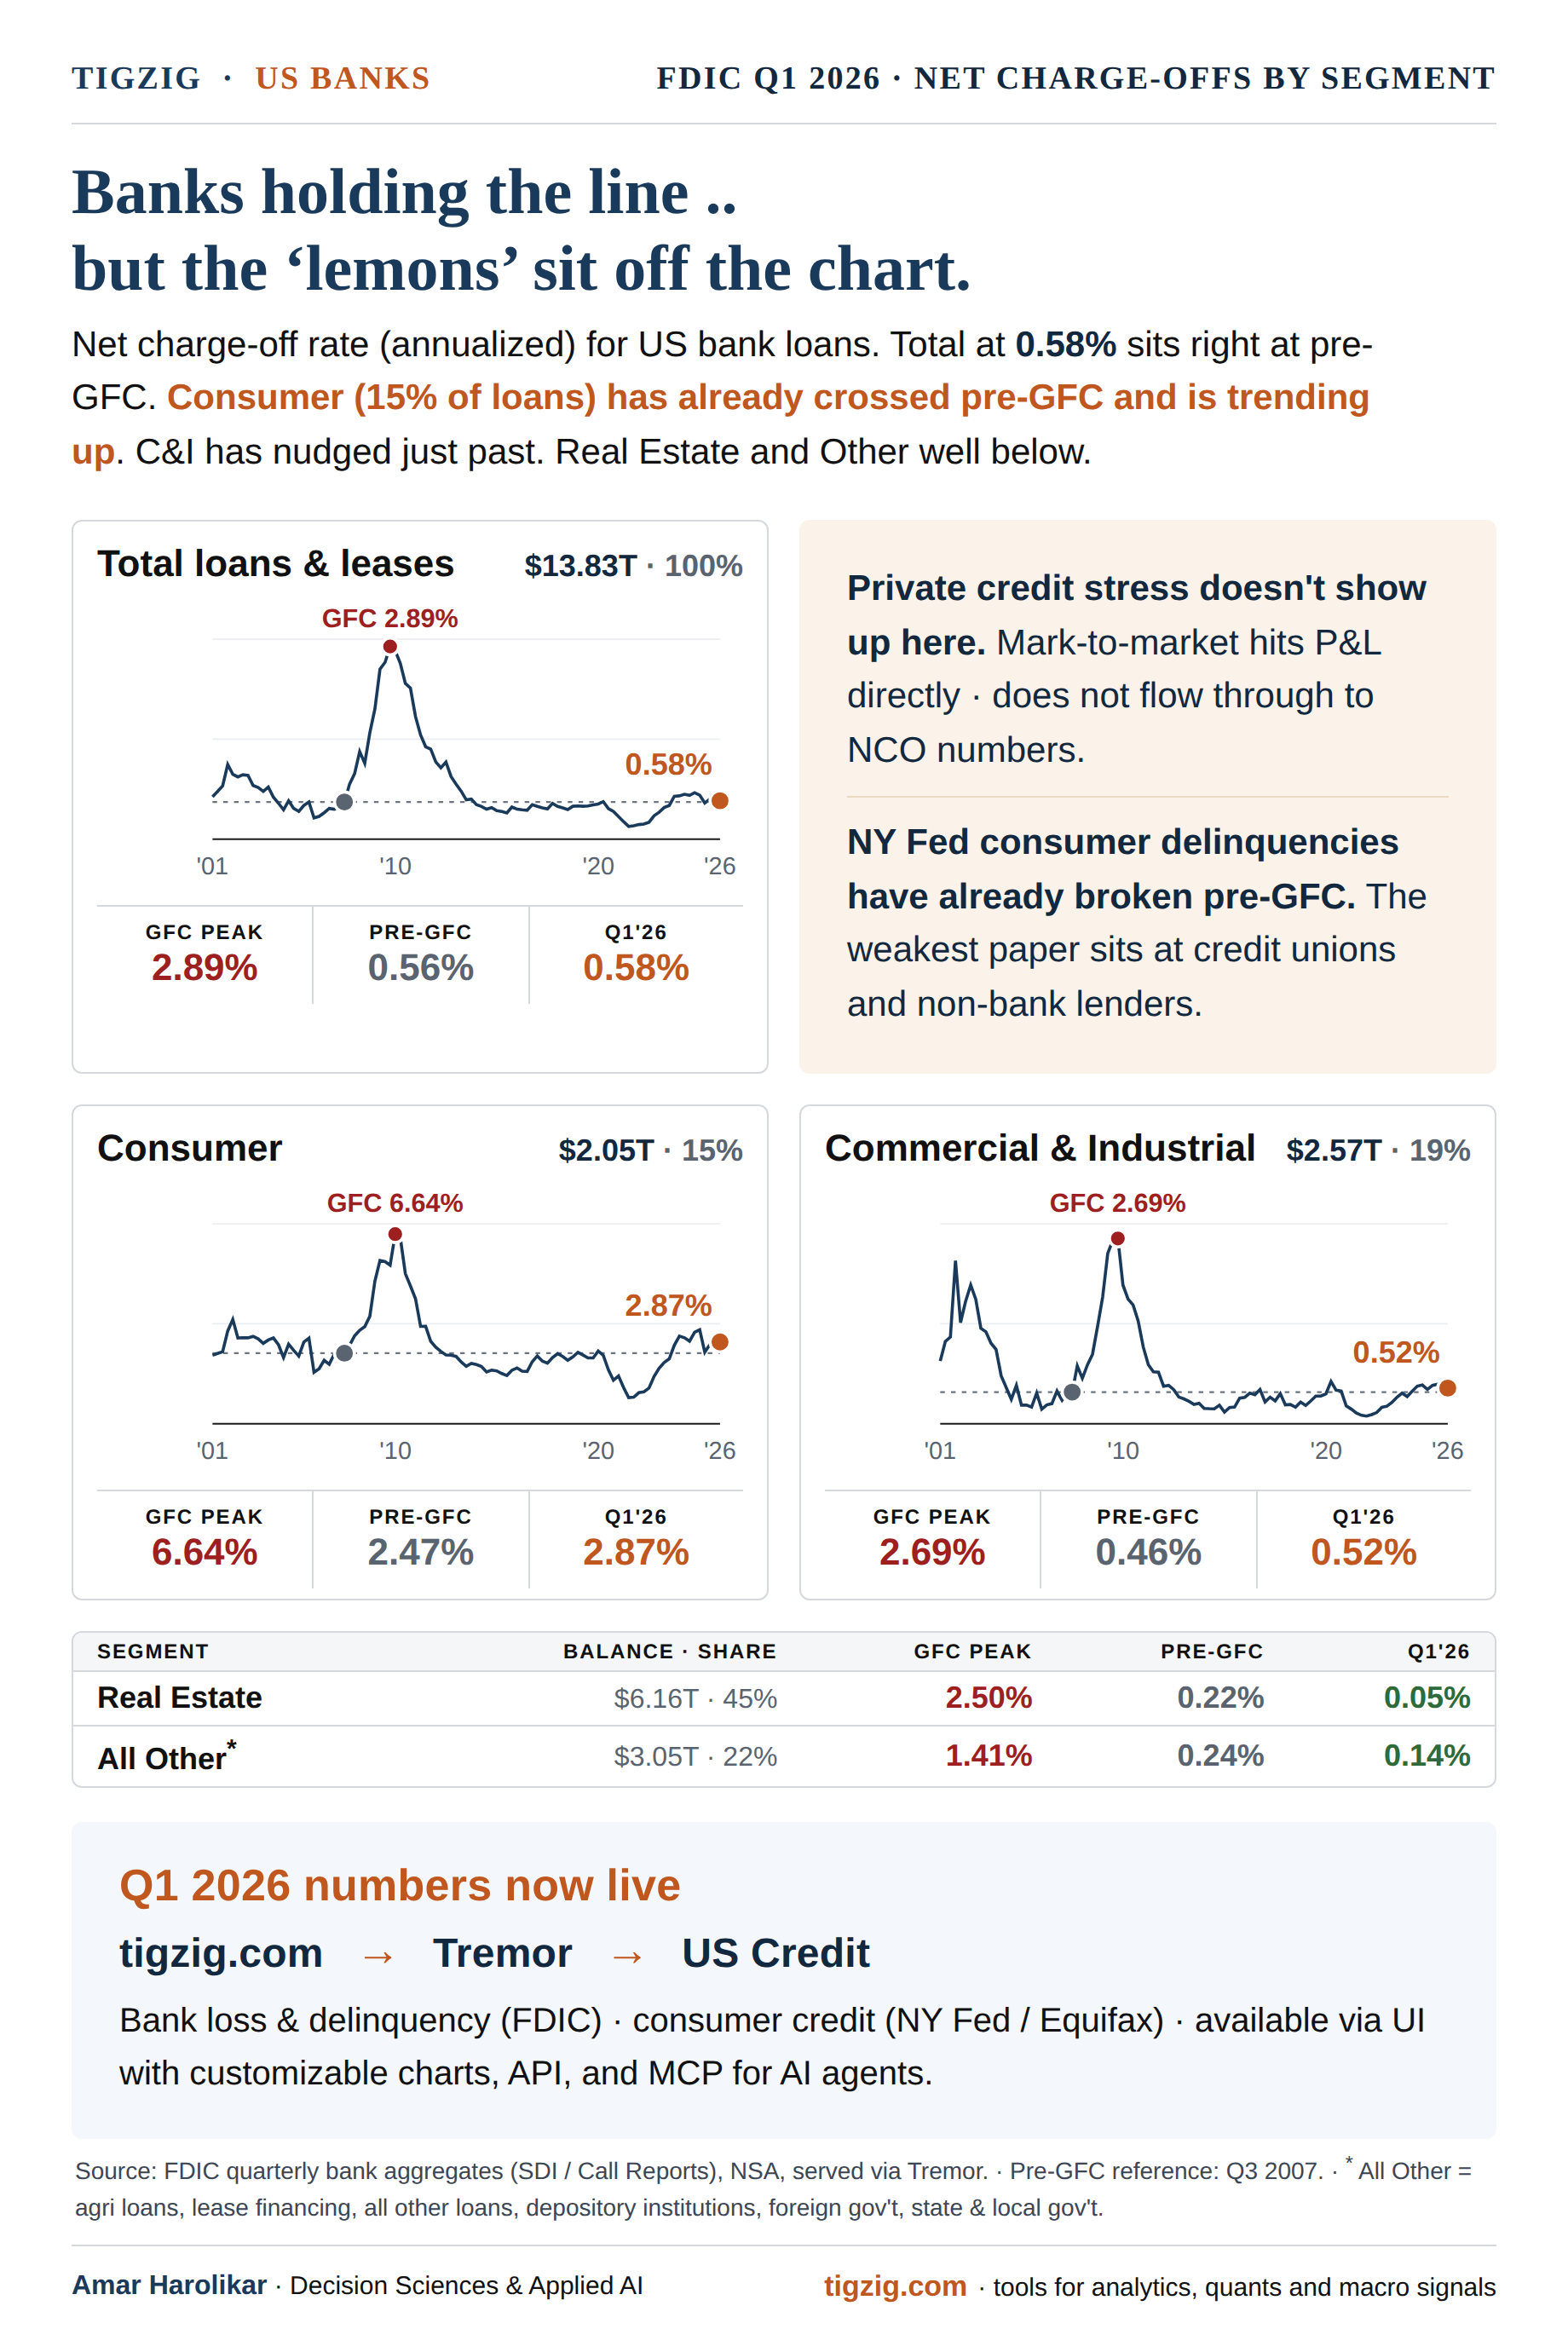
Banks Holding the Line.. But the 'Lemons' Sit Off the Chart. In Private Credit, Credit Unions, and Non-Bank Consumer Lenders.
FDIC Q1 2026 NCO chart shows US banks holding the line at 0.58%, right at pre-GFC. Real Estate (45% of book) at 0.05% vs 2.50% GFC peak. Consumer at 2.87% (vs 6.64% GFC). C&I 0.52% (vs 2.69%). But the credit stress is in two places the bank NCO chart doesn't show. First: private credit, which is mark-to-market and hits P&L directly, never flowing through to NCO. Bank loans to non-bank lenders crossed ~$1.6T (FFIEC) with about a quarter being private credit. DOJ probing BlackRock fund valuations, FSB/BoE/ECB all warning on data gaps, opacity and spillover risk. Second: credit unions and non-bank consumer lenders. NCUA consumer NCO at 1.82% (nearly 2x pre-crisis), cards at 5.11% past the 4.68% GFC peak, used vehicle loans at the highest on record. Non-banks carrying the weakest paper. Single-image chart post with Q1 2026 numbers across the bank book - Total Loans 0.58%, Real Estate, Consumer, C&I segments and All Other.
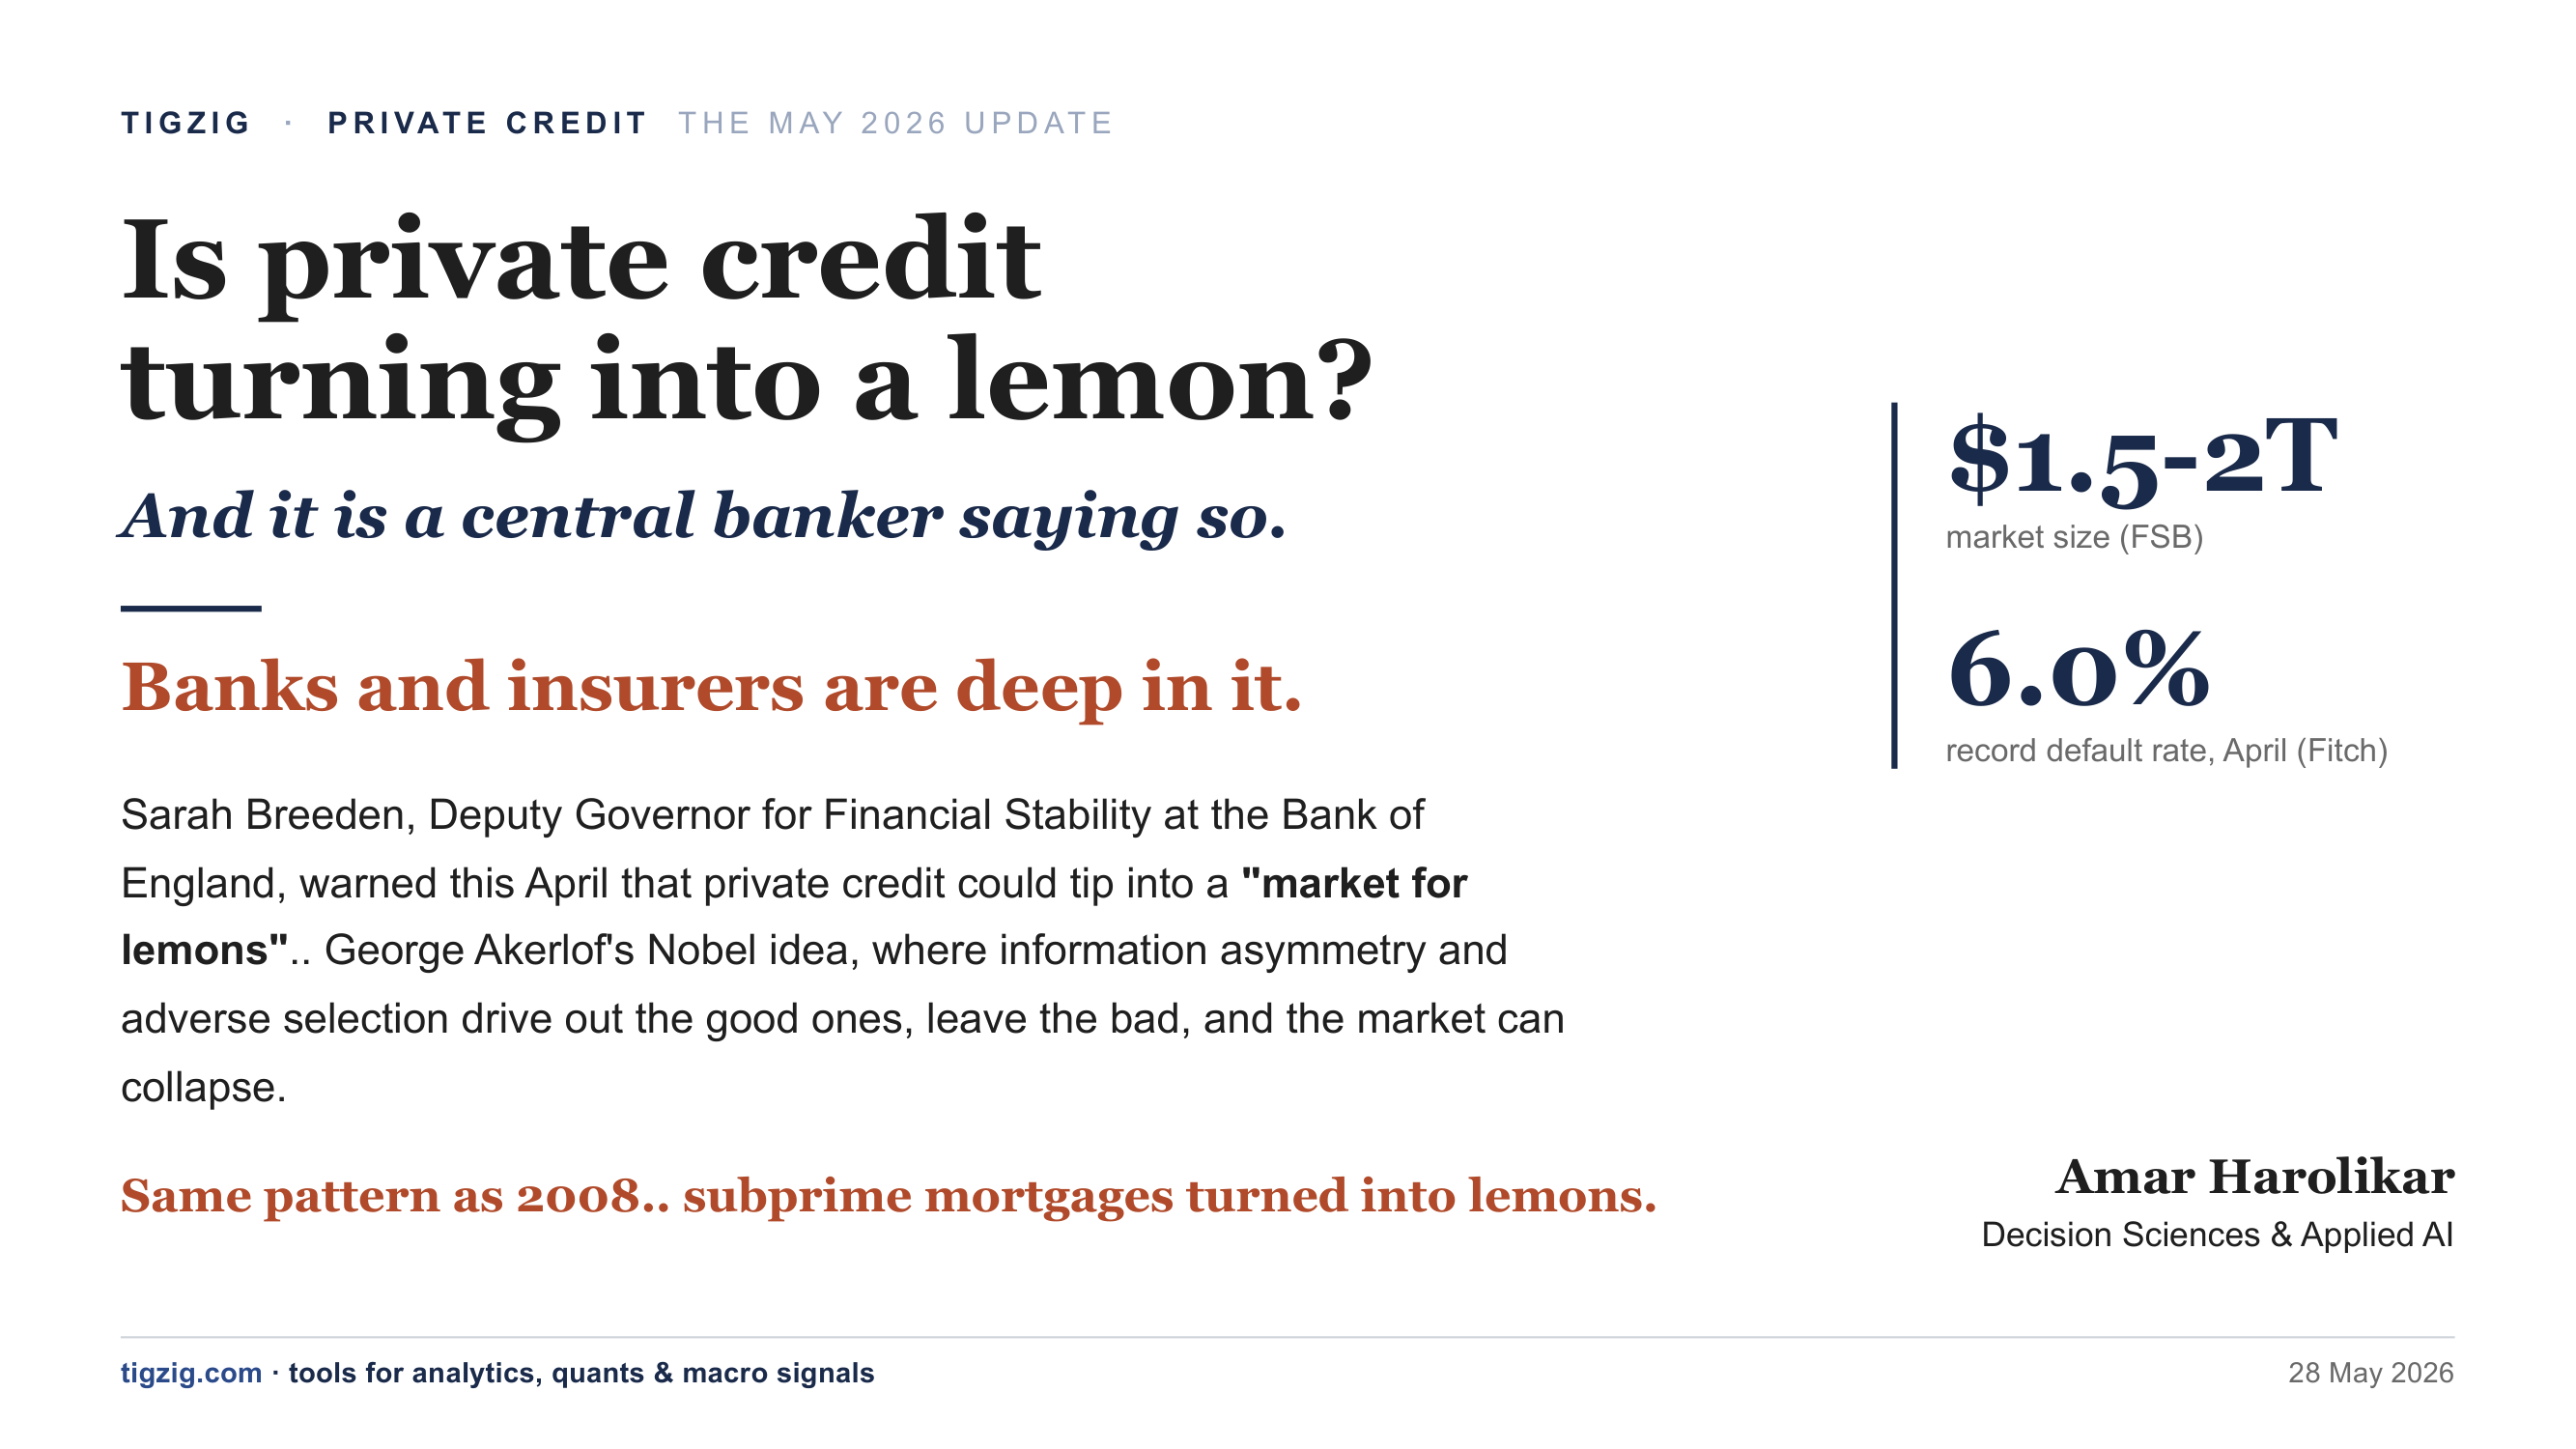
Private Credit Default Rate Hits a Record 6.0% (2026): A Market for Lemons? Banks and Insurers Deep In It.
Private credit's default rate hit a record 6.0% in April 2026 (Fitch, trailing 12 months). Bank of England's Sarah Breeden invokes Akerlof's 'market for lemons'; a government report calls it a layered cake like 2008 subprime. Banks and insurers are deep in - JPMorgan $22B, Citi $22B, Deutsche $30B - with a 19% off-cycle NAV writedown, a $648M bank credit-line cut, KKR rescuing its own FSK fund, and a DOJ probe into BlackRock TCPC valuations. Numbers with sources.
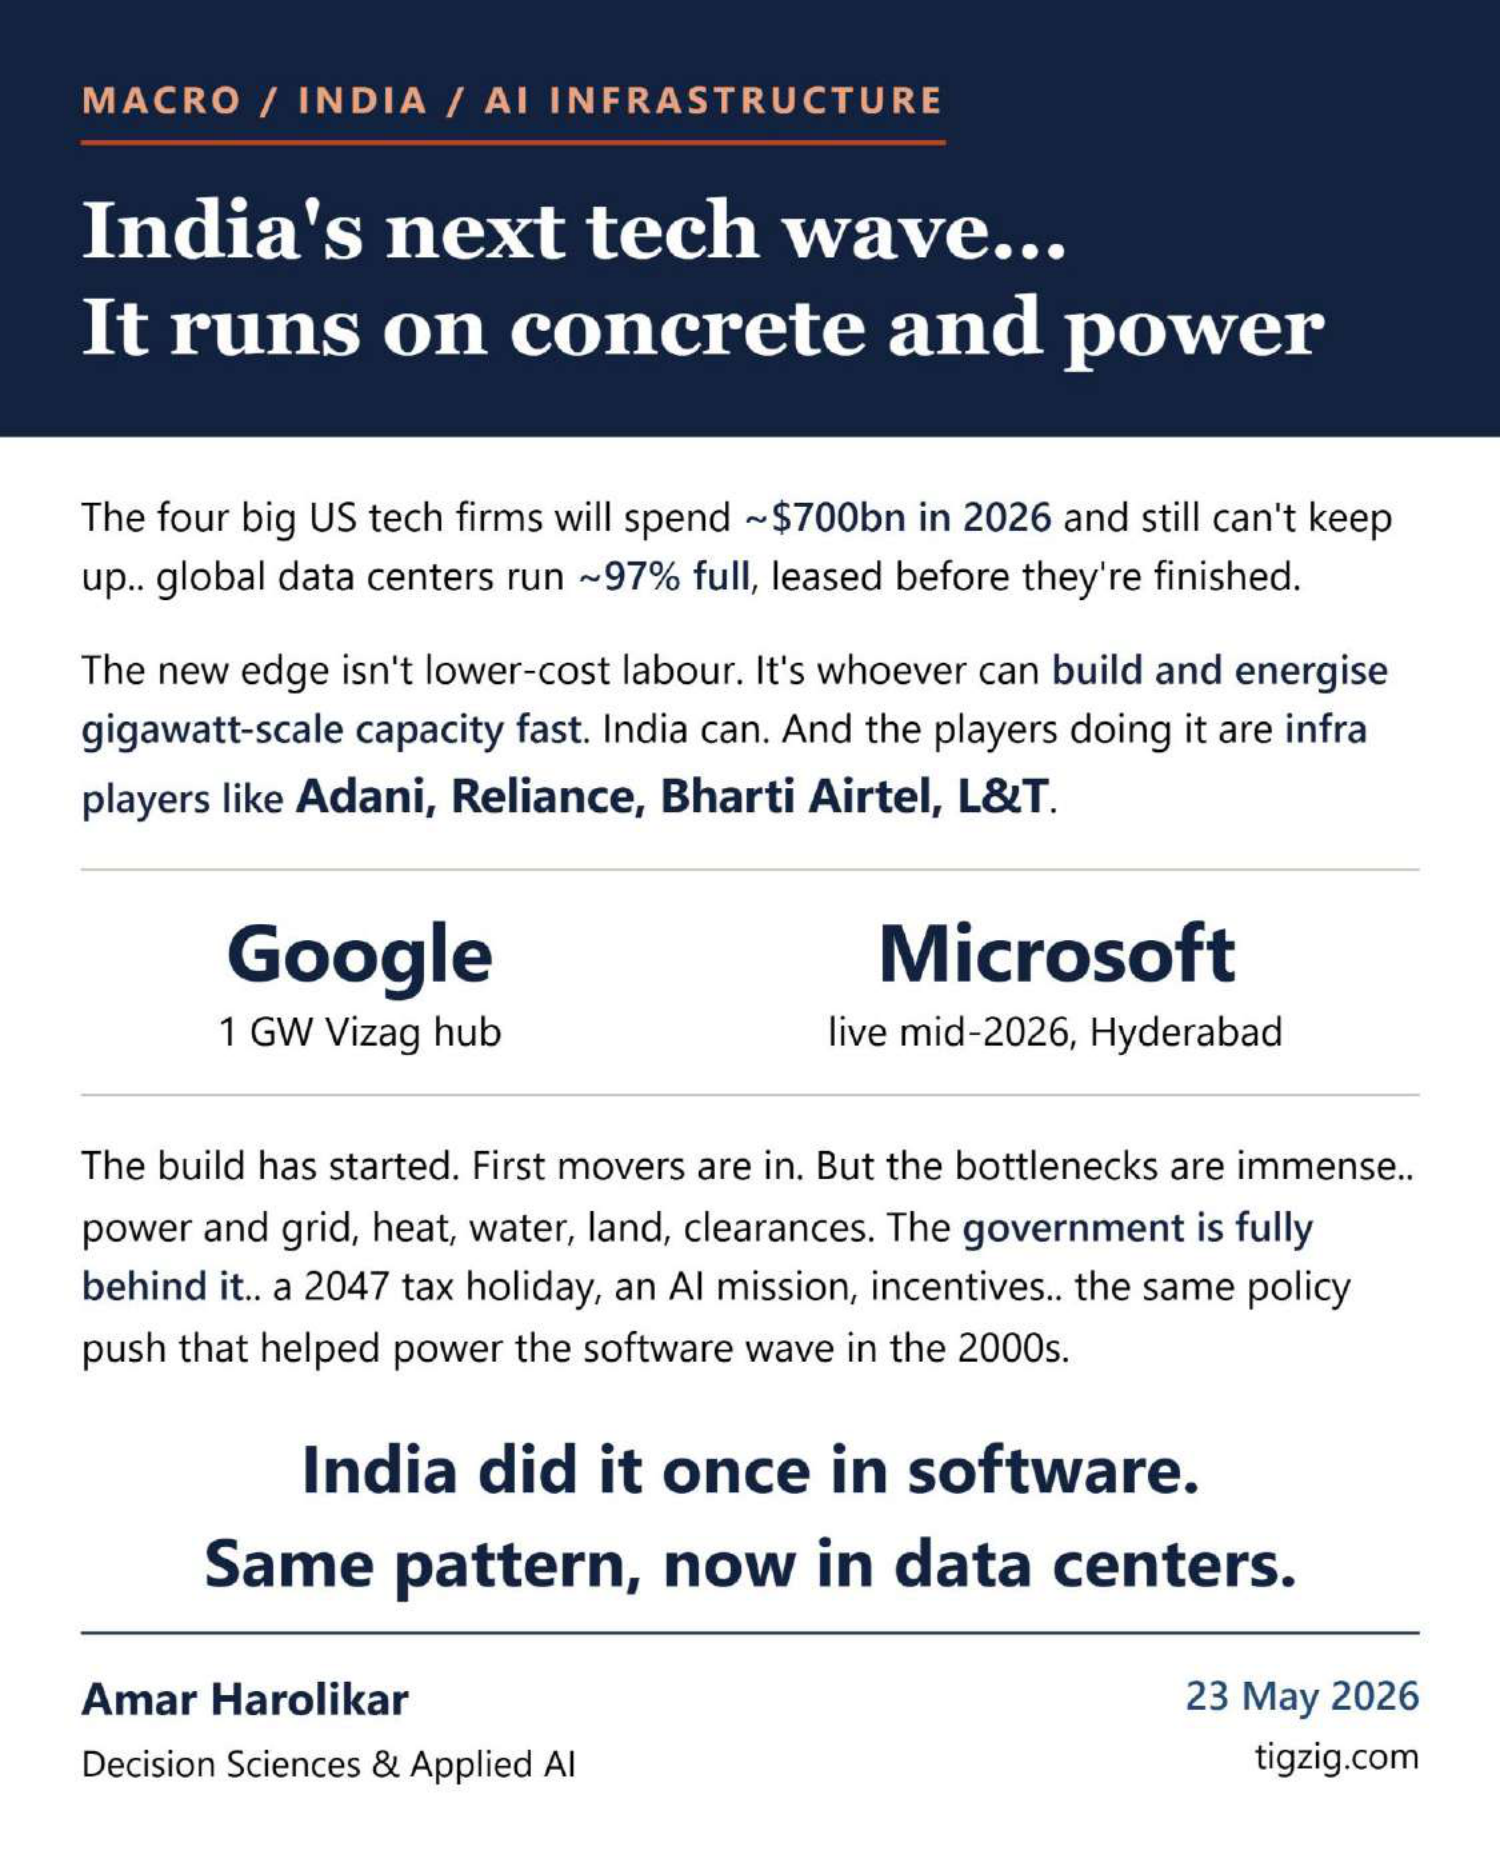
India's Next Tech Wave. AI Data Centers for the World. Adani, Reliance, Airtel, L&T. Same Pattern as Software in the 2000s.
India's next tech wave - AI data centers for the world - is being built by infra players Adani, Reliance, Bharti Airtel and L&T. World is out of compute and out of power - global data centers ~97% full, leased before they're finished. Big-4 US tech firms guided ~$700bn capex in 2026 and still can't keep up. First movers in India: Google's $15bn / 1 GW Vizag hub (largest outside US), Adani $100bn by 2035, Reliance $110bn / 7yr Jamnagar, Microsoft $17.5bn Hyderabad live mid-2026, AWS $12.7bn by 2030, TCS HyperVault. Government policy backing: 2047 tax holiday for foreign cloud firms, IndiaAI Mission, 15% safe harbour. India's edge isn't lower-cost labour - it's industrial build muscle for gigawatt-scale capacity. Risks covered: US-India relations and chip access, water and heat in stressed regions, land approvals. Includes 15-slide deck and full source links (JLL, McKinsey, CEEW, Jefferies, BIS, CNBC, Google, Microsoft, Adani, Reliance, etc.).
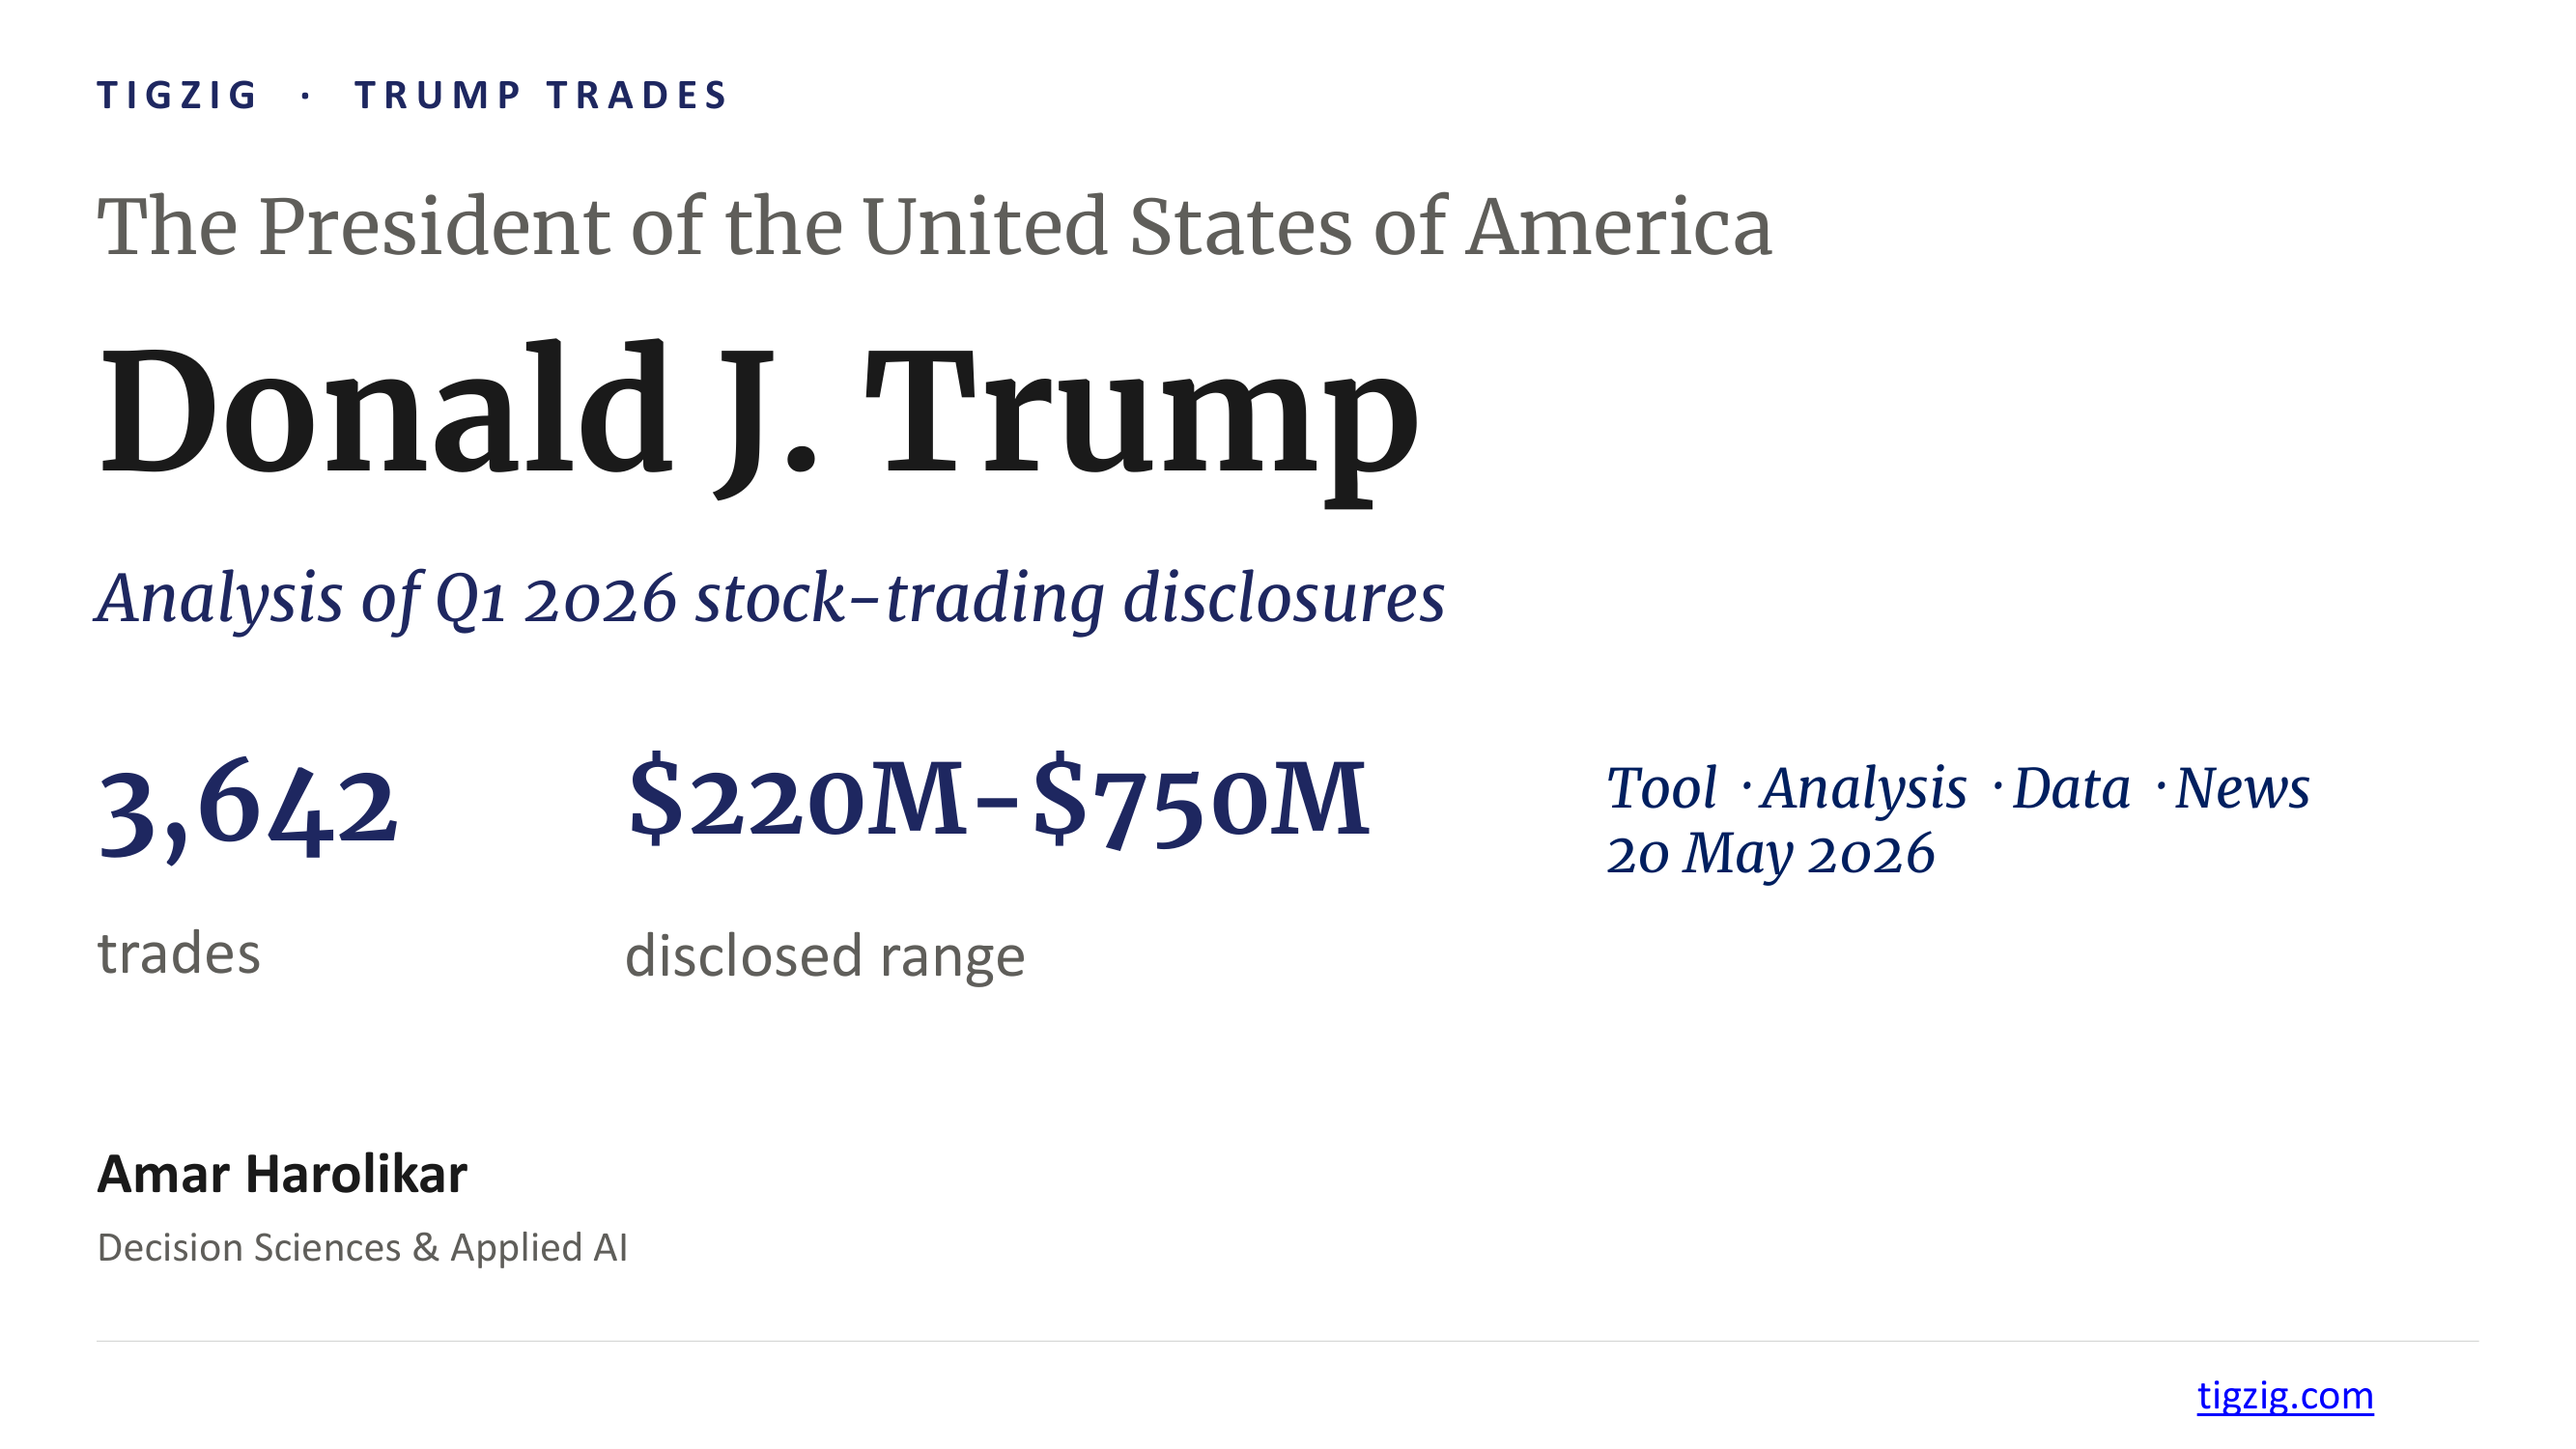
Trump Trades. From Mostly Bonds to 3,642 Equity Trades in One Filing. Free Tool to Search Every Transaction.
9 months of mostly bonds in President Trump's OGE filings broken by one filing on 14 May 2026 carrying 3,642 equity trades, $220M to $750M. Heavy activity in Nvidia, Apple, Microsoft, Amazon, Meta, Oracle. 15 filings since Aug 2025 - earlier 14 combined had 1,726 trades almost all bonds. Built a free interactive tool on top of the OGE PDFs - every transaction searchable across 1,058 tickers, click any company to see trade timeline overlaid on price chart, CSV download. Short analysis deck included on most active tickers, top buys, top sells, and policy overlaps press has flagged.
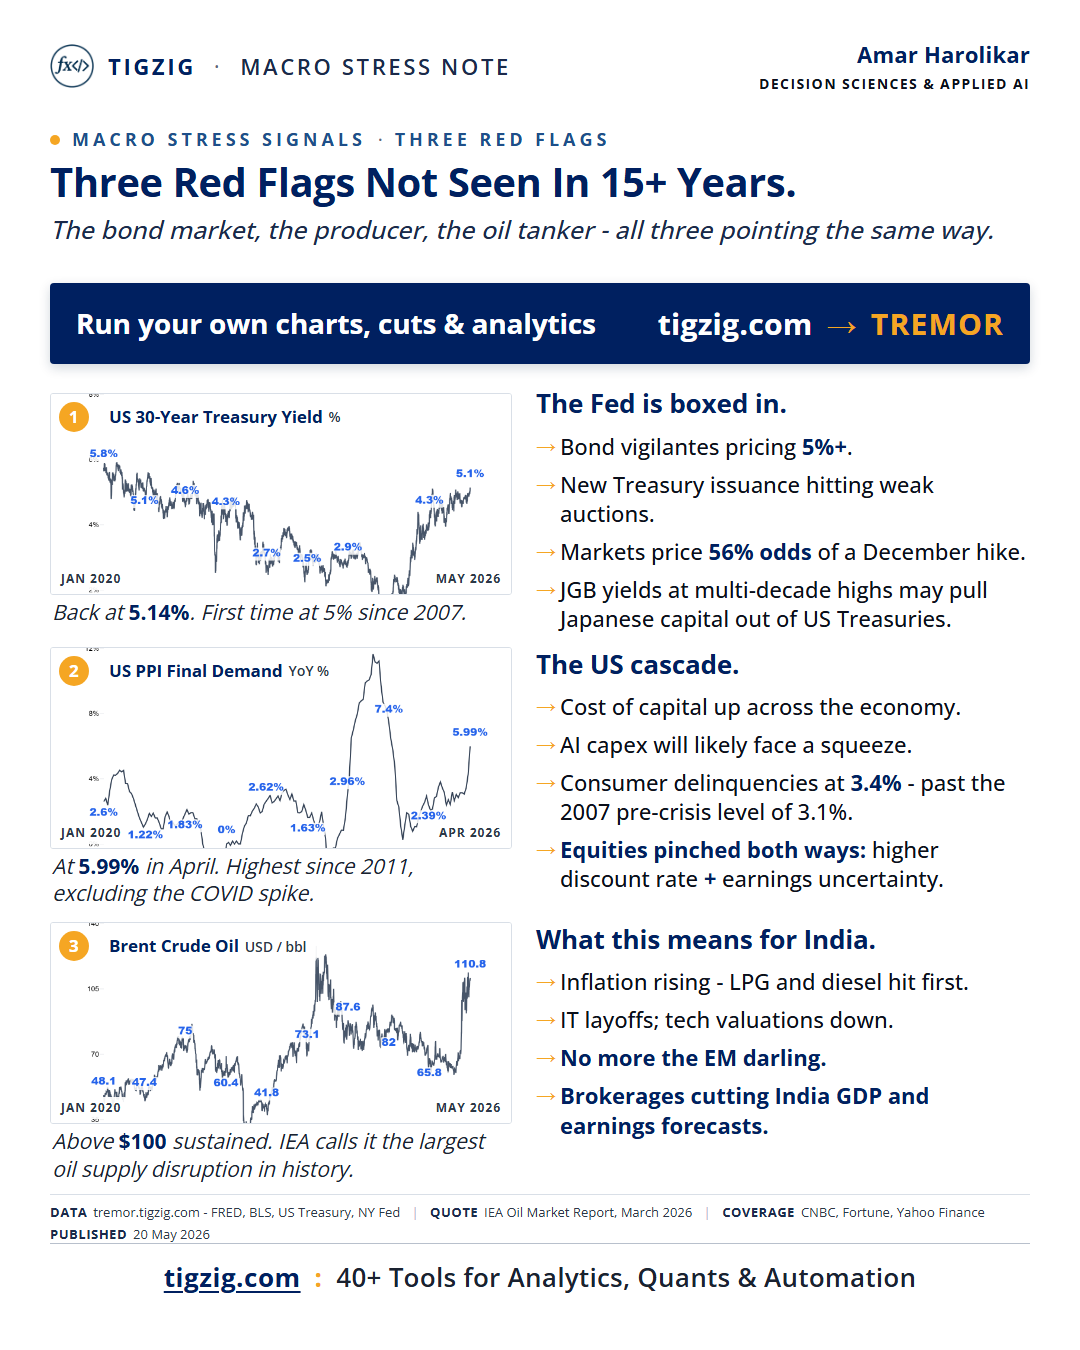
Three Red Flags Hit Together. 30Y at 5.14%, PPI at 5.99%, Brent Above $100. Setup Worse Than 2000 or 2007.
Three macro red flags hit at the same time, each a major disruptor on its own: US 30-year Treasury yield 5.14% (first since 2007), US Producer prices 5.99% (15-year high ex-COVID), Brent above $100 (IEA calls it the largest oil supply disruption in history). Alongside: S&P 7,400 with CAPE 39.6 (2nd-highest in 145 years), auto loan losses past 2007 GFC peak, unemployment near Q3 2007 levels, Mag 7 ~35% of S&P (NVIDIA alone 8.9%). The last time these general patterns showed up: 2000 and 2007. 2026 is looking worse.
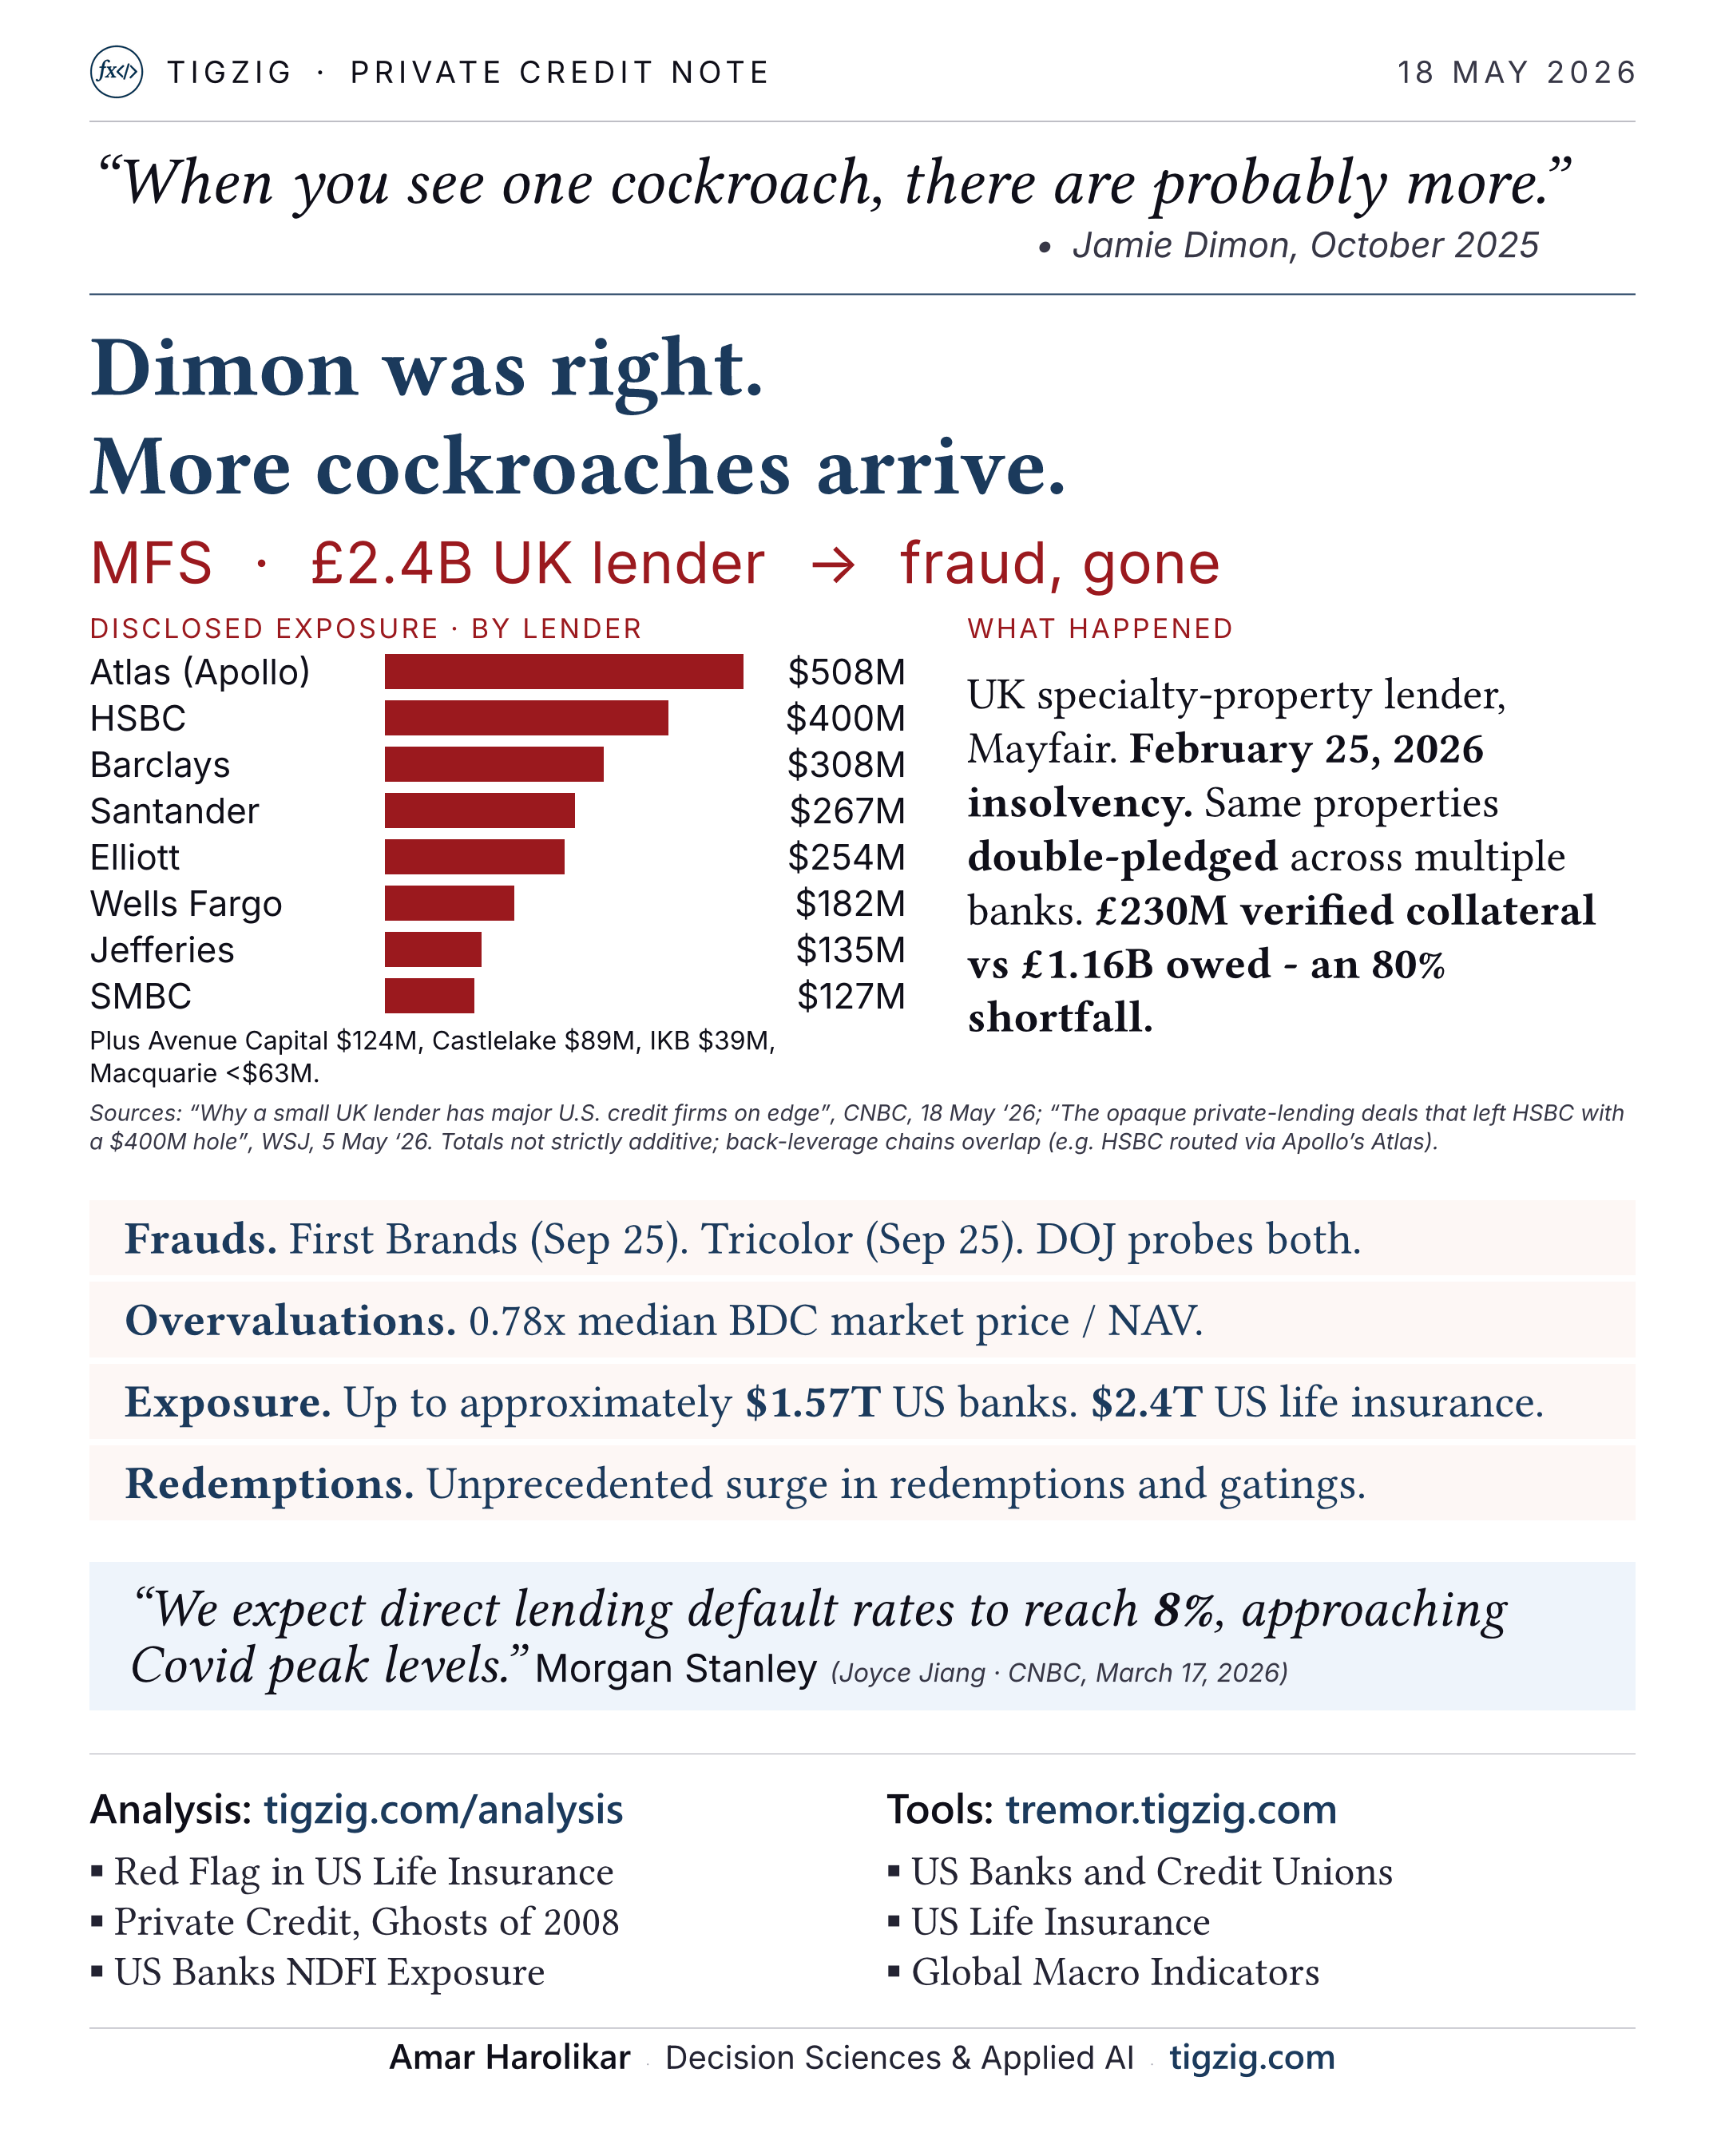
Dimon Was Right. More Cockroaches Arrive. UK Lender MFS Collapses - $2.5B Across 12+ Global Banks.
UK lender MFS collapsed in February with $2.5B exposure across 12+ global banks - Barclays $308M, HSBC $400M, Atlas/Apollo $508M, Santander $267M, Elliott $254M, Wells Fargo $182M. £2.4B loan book, fraud and double-pledging allegations. £230M verified collateral against £1.16B owed (80% shortfall). Affiliated lending chain: HSBC > Apollo Atlas > Zircon Bridging > MFS.
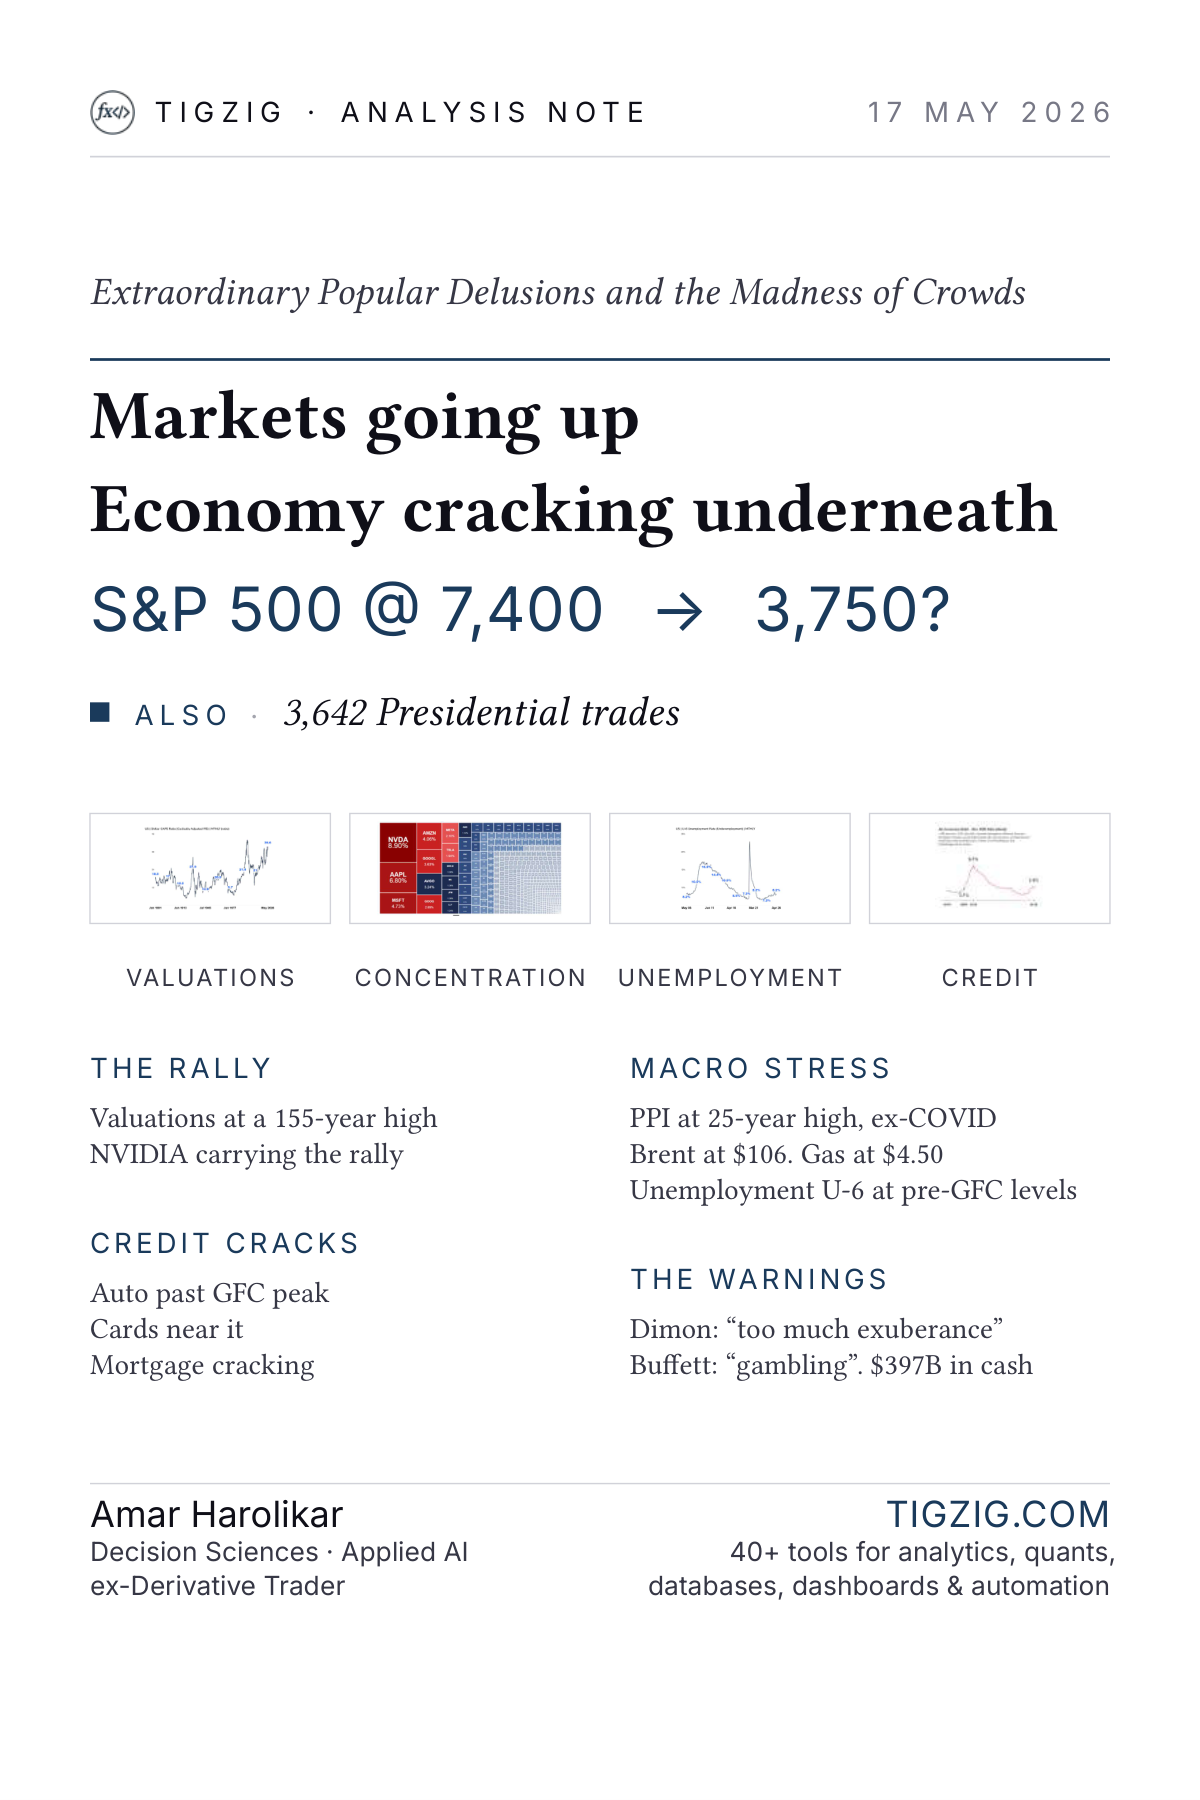
S&P at 7,400. Irrational Exuberance. The Last Two Times This Setup Held, the Index Halved.
S&P 500 at 7,400 with Irrational Exuberance. Last two times setup held: 2000 dot com -49% in 30 months, 2007 subprime -57% in 17 months. Apply pattern math, S&P lands 3,200-3,800. CAPE 39.6 (2nd time in 145 years), auto delinquencies past GFC peak, U-6 back to pre-GFC, PPI 25-year high ex-COVID, Brent $106. Dimon: too much exuberance. Buffett on $397B cash.
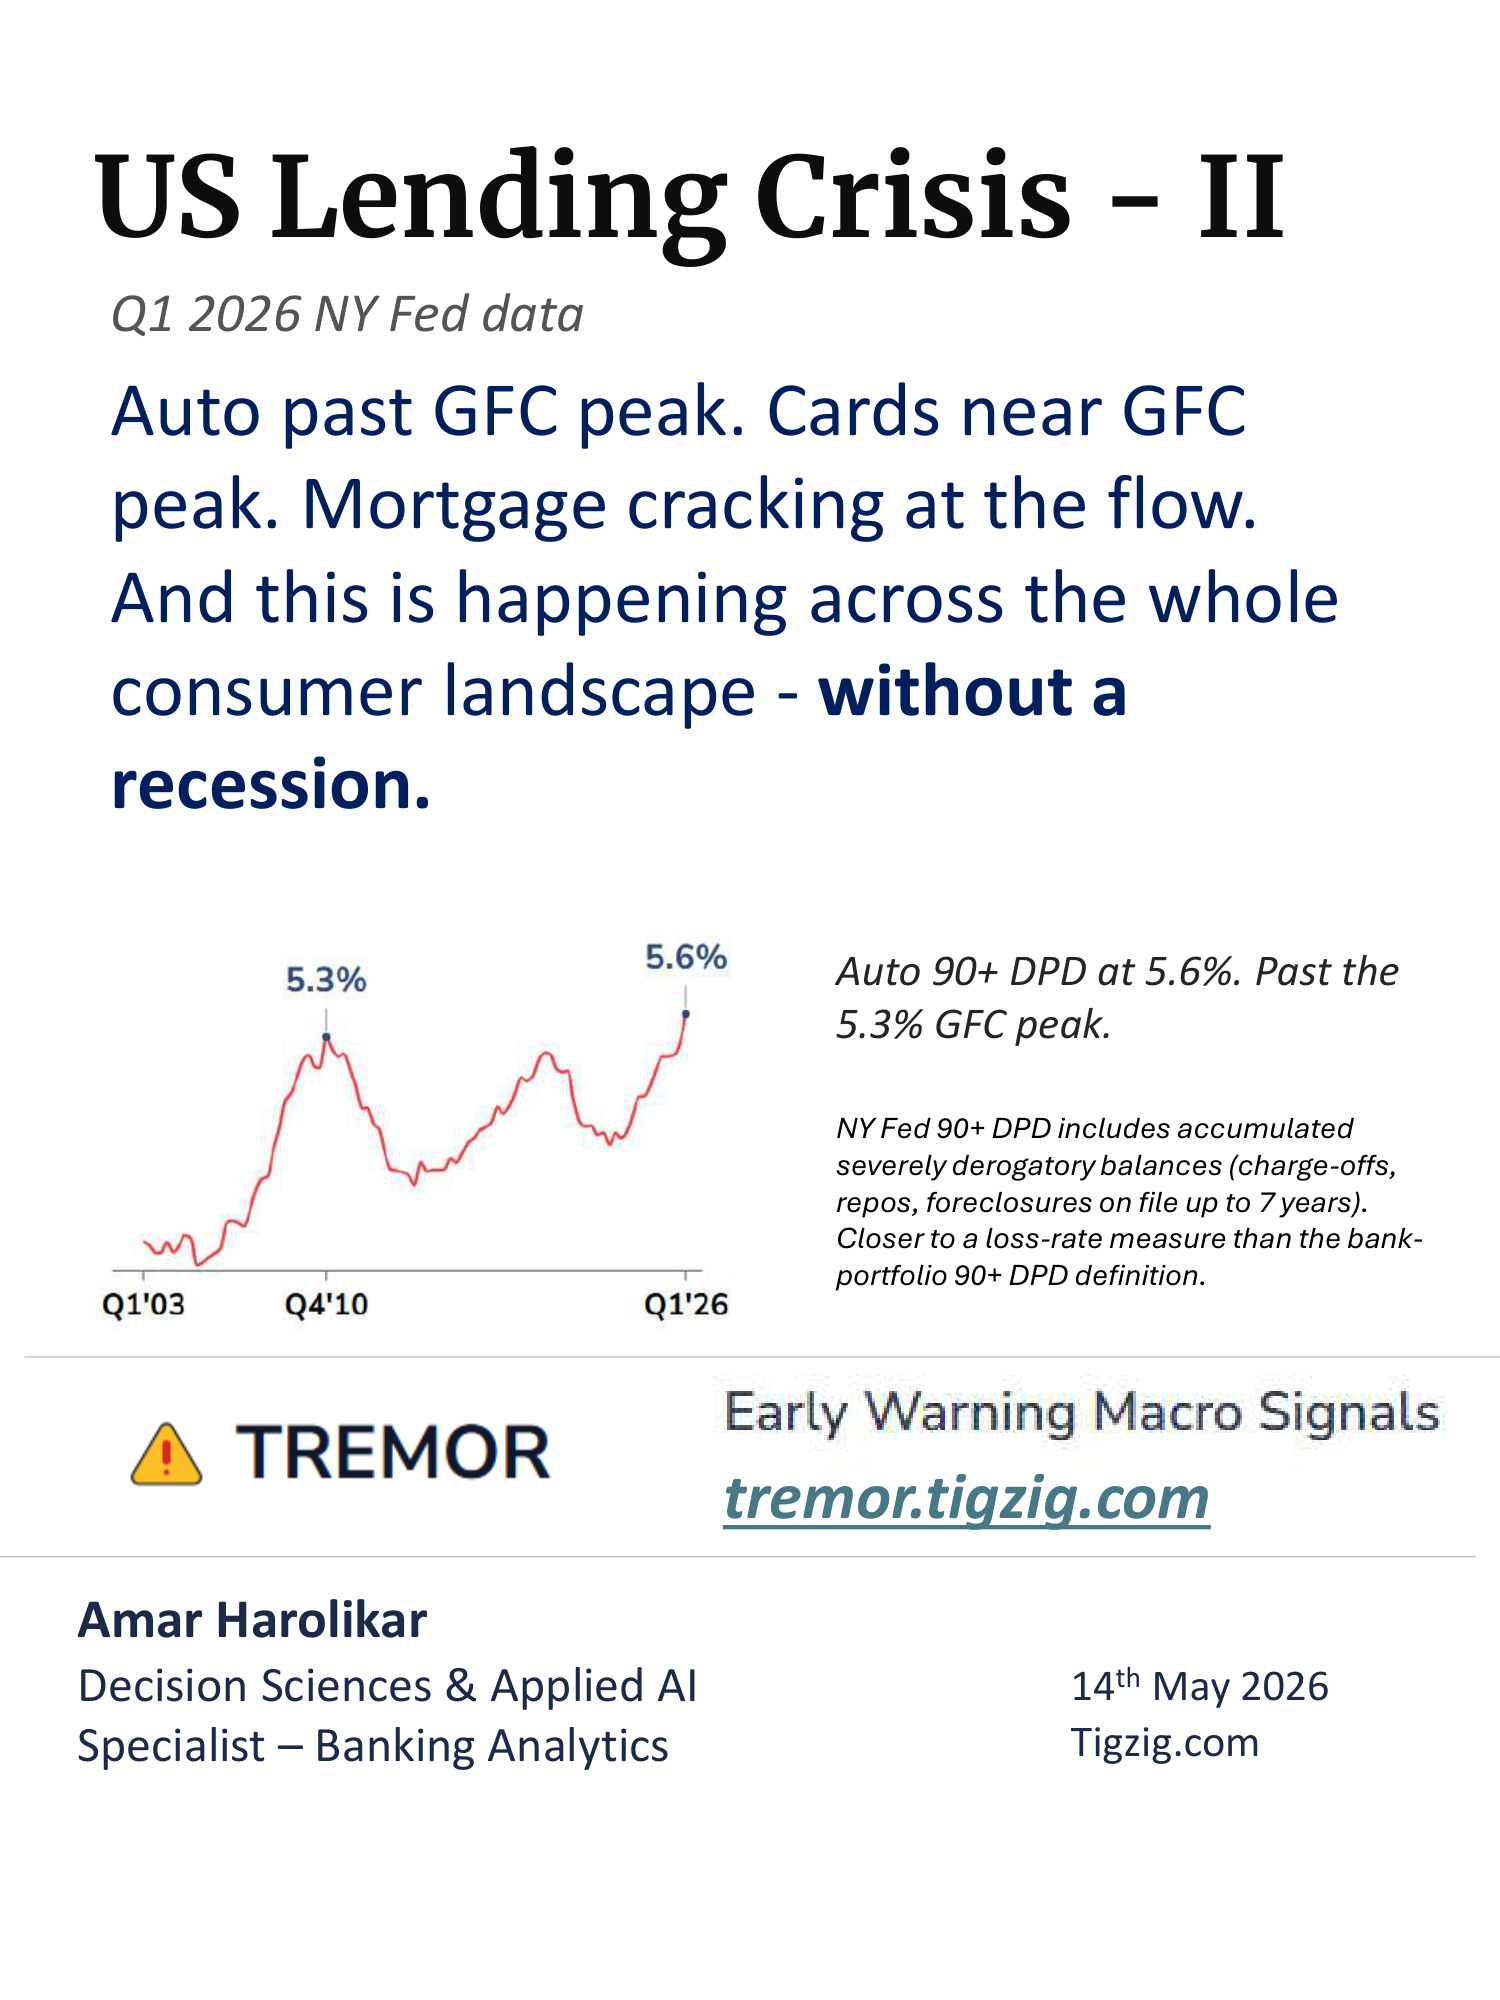
US Consumer Lending Is Already at Crisis-Level Numbers - Without a Recession. NY Fed Q1 2026 Data.
NY Fed Q1 2026 release. Auto delinquencies past GFC peak. Cards near it. Mortgage stock calm but flow rate cracking. HELOC usage and delinquencies rising. Home prices down 9% from 2022 peak. U-6 unemployment back to pre-GFC 2007 levels. Underwater mortgages up in 45 states YoY. Crisis numbers without a recession.
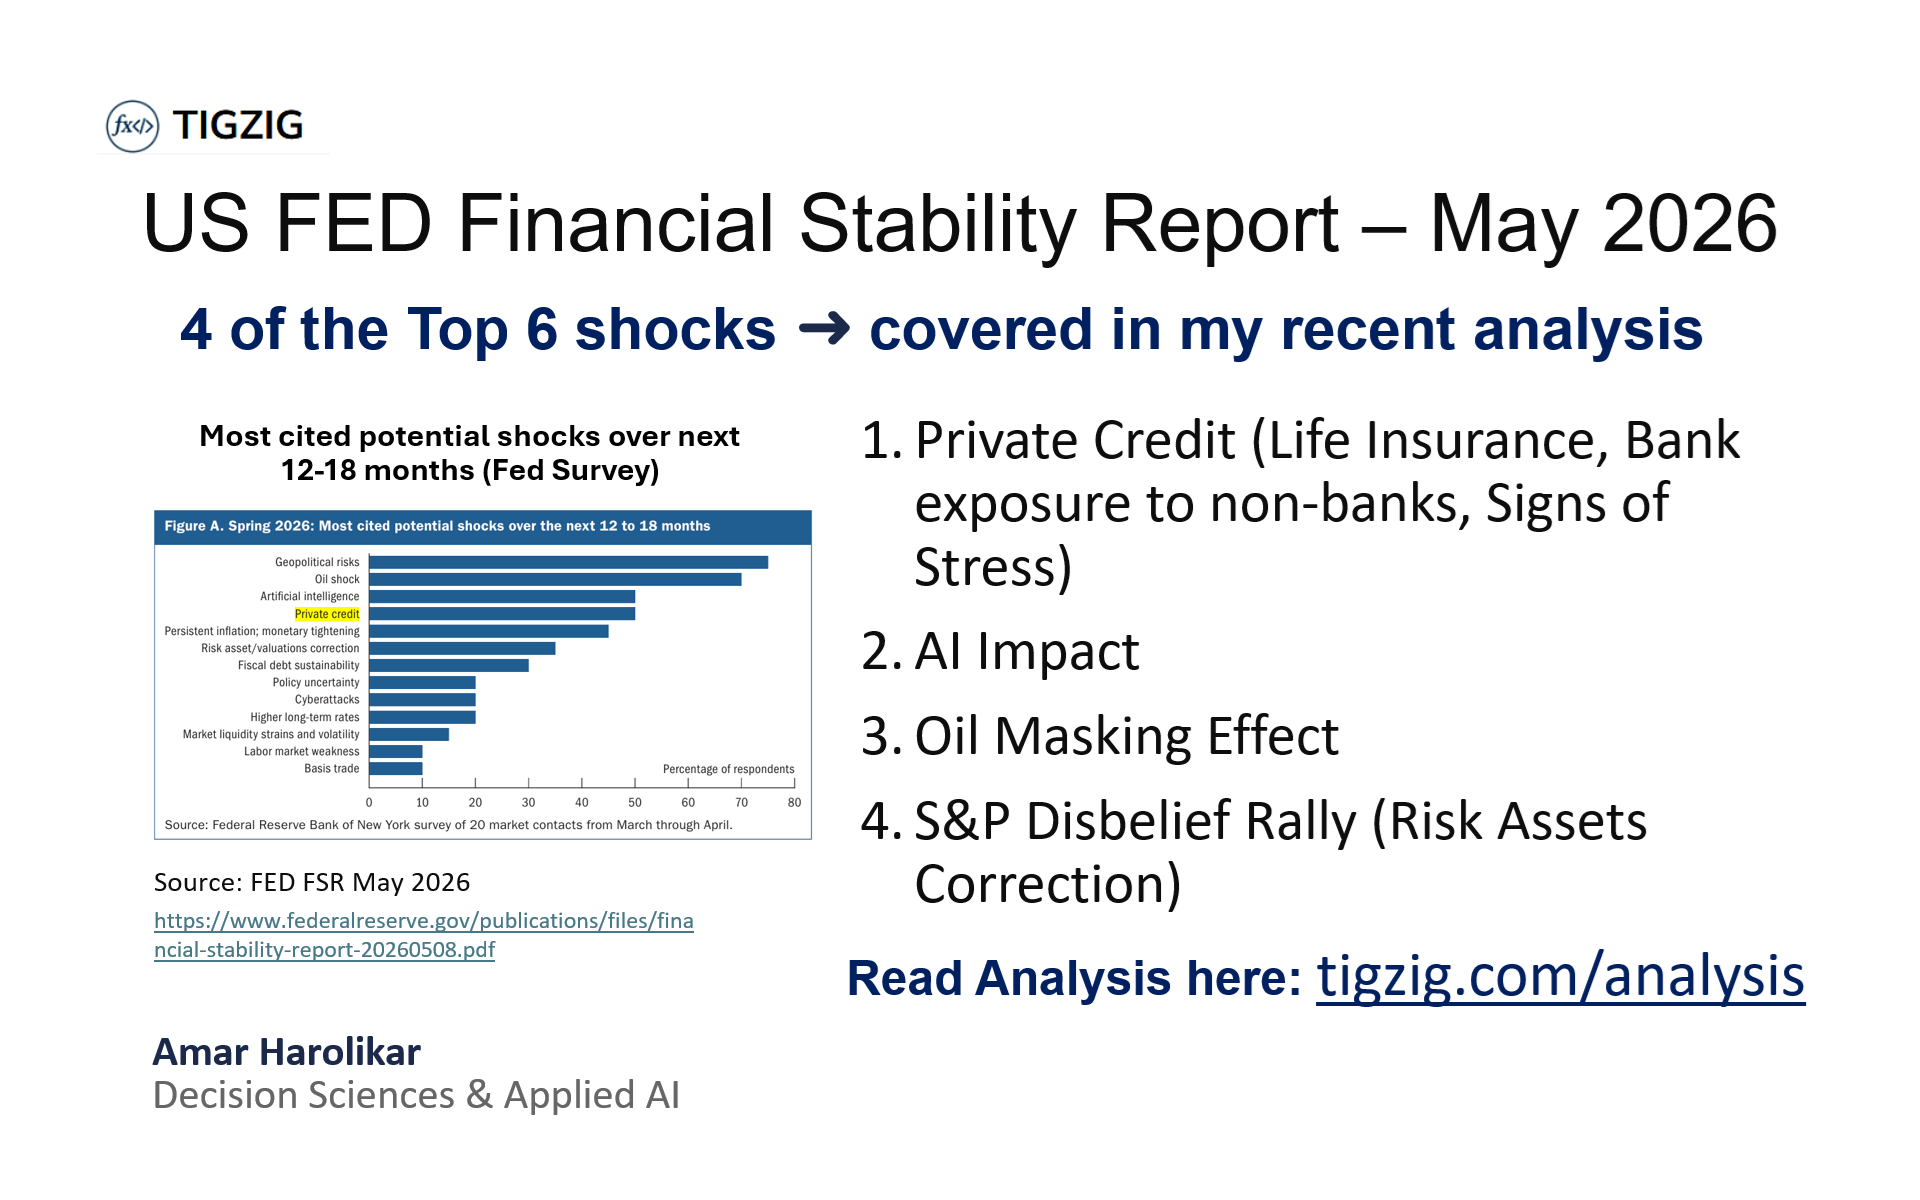
US Fed Financial Stability Report May 2026. Same Stress Points - Now in Fed Own Survey.
US Fed FSR May 2026 covers 4 of the top 6 shocks already in tigzig.com/analysis - private credit (life insurance exposure, bank lending to non-banks), AI impact (labor displacement), oil shock (spot-futures divergence), risk asset correction (S&P disbelief rally). Plus consumer/auto lending stress and stagflation-lite.
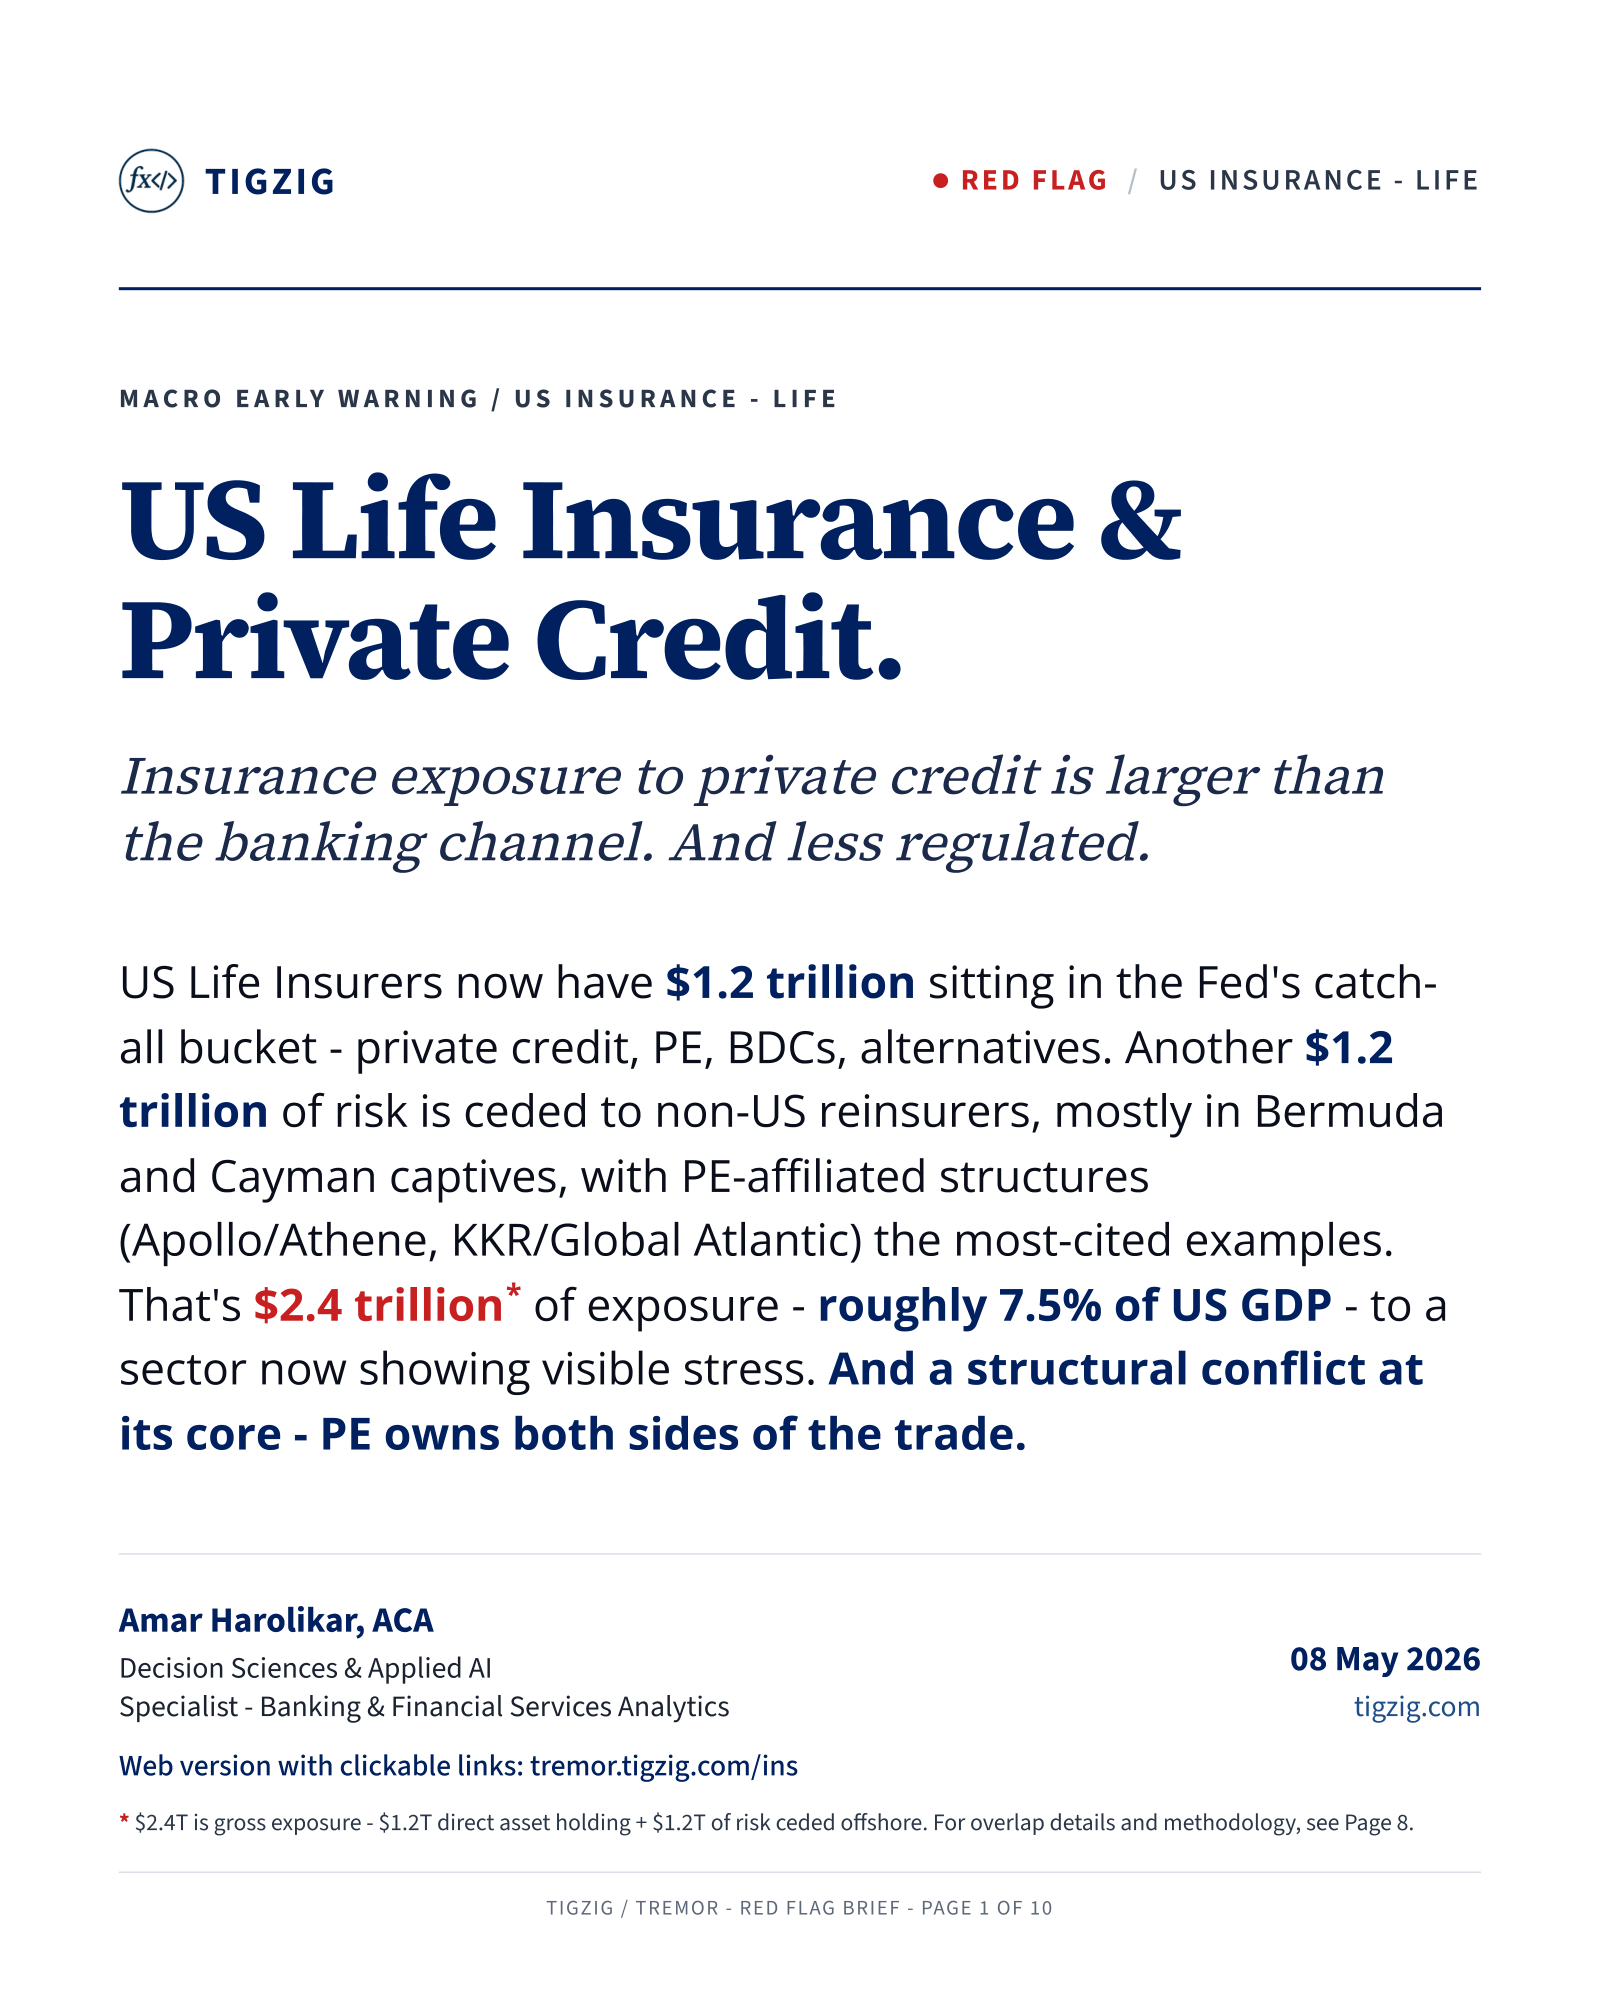
Red Flag in US Life Insurance. $2.4T (7.5% of GDP) in Private Credit and Offshore Reinsurance.
US Life Insurers have $2.4T (7.5% of US GDP) in private credit and offshore reinsurance. $1.2T in Fed Unidentified Misc Assets, $1.2T offshore reinsurance memo. Both nearly doubled in 5 years. PE-affiliated loop - same firms own insurers, credit funds and offshore reinsurers. Doom loop risk if retirees surrender annuities en masse.
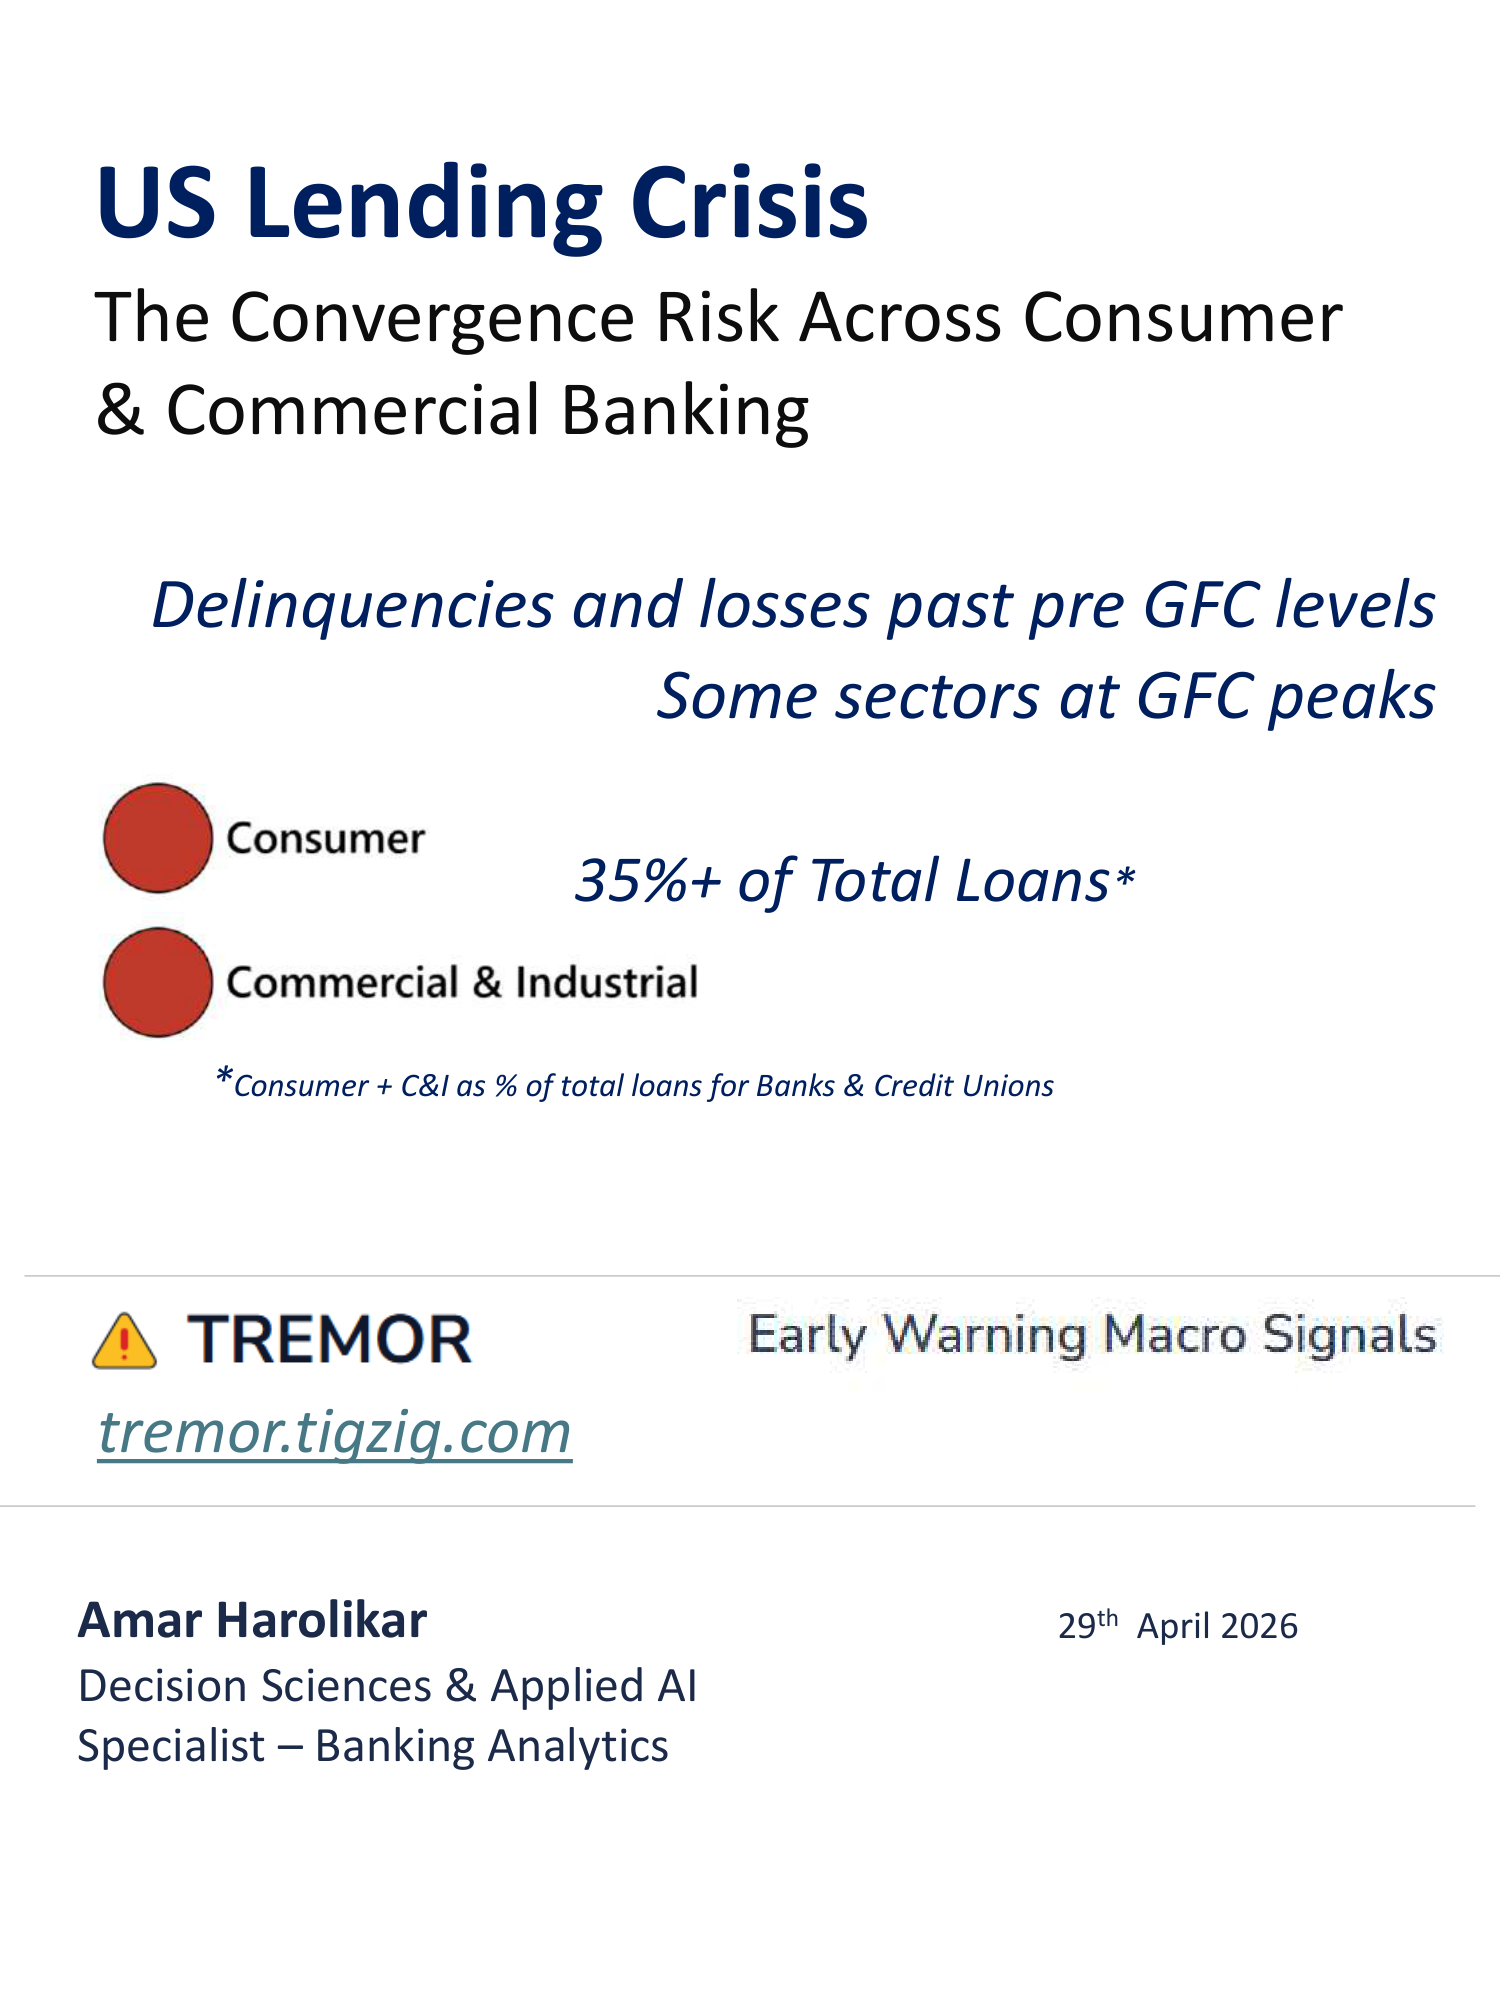
The Convergence Risk. Credit Stress Already Past 2007 Pre-Crisis. Five Aggravators Stacking On Top.
Multiple credit stress signals at the same time across US banks, credit unions, consumer debt. Past 2007 pre-crisis on most metrics. Auto loans already at GFC peak. 5 aggravators on top - AI labor shock, U-1 above 2007, GDP at 0.5%, Brent $100+, private credit stress with $2.5T+ exposure. Warnings from Jamie Dimon and Sarah Breeden.
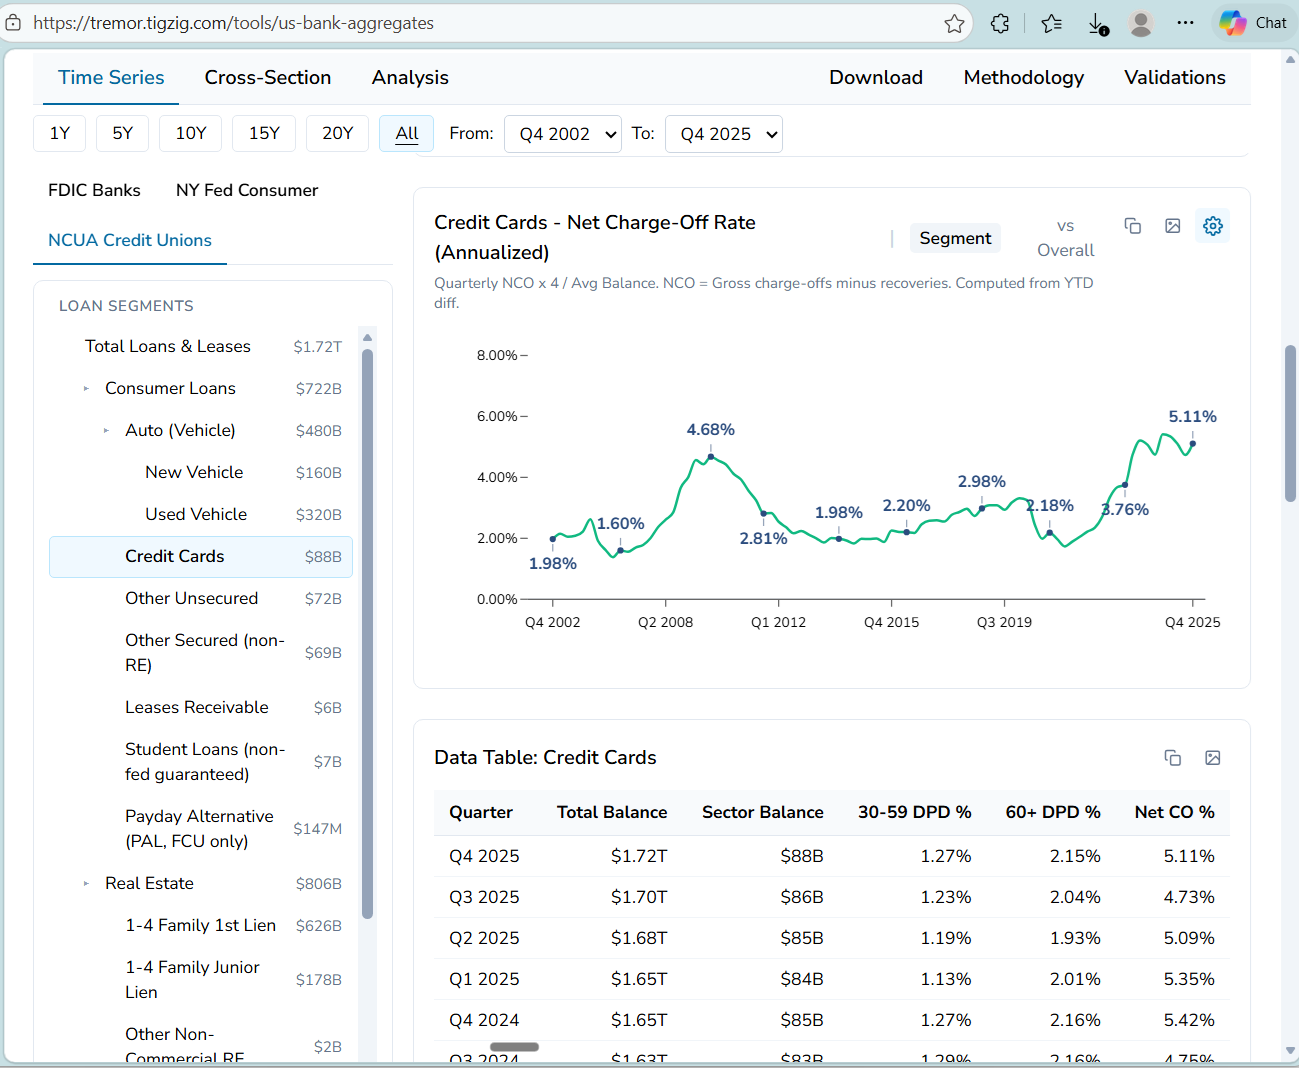
US Credit Unions on TREMOR. Card Charge-Offs at 5.11% - Already Past the 2009 GFC Peak.
US Credit Unions analytics on TREMOR. 23 years, 86 quarters, $1.72T loans across 4,287 federally-insured credit unions from NCUA quarterly FPR. Card NCO at 5.11% past 4.68% GFC peak. Consumer NCO at 1.82% vs 0.99% pre-crisis. 18 segments, 30-59 DPD, 60+ DPD, NCO. CSV download with 74-field reference.
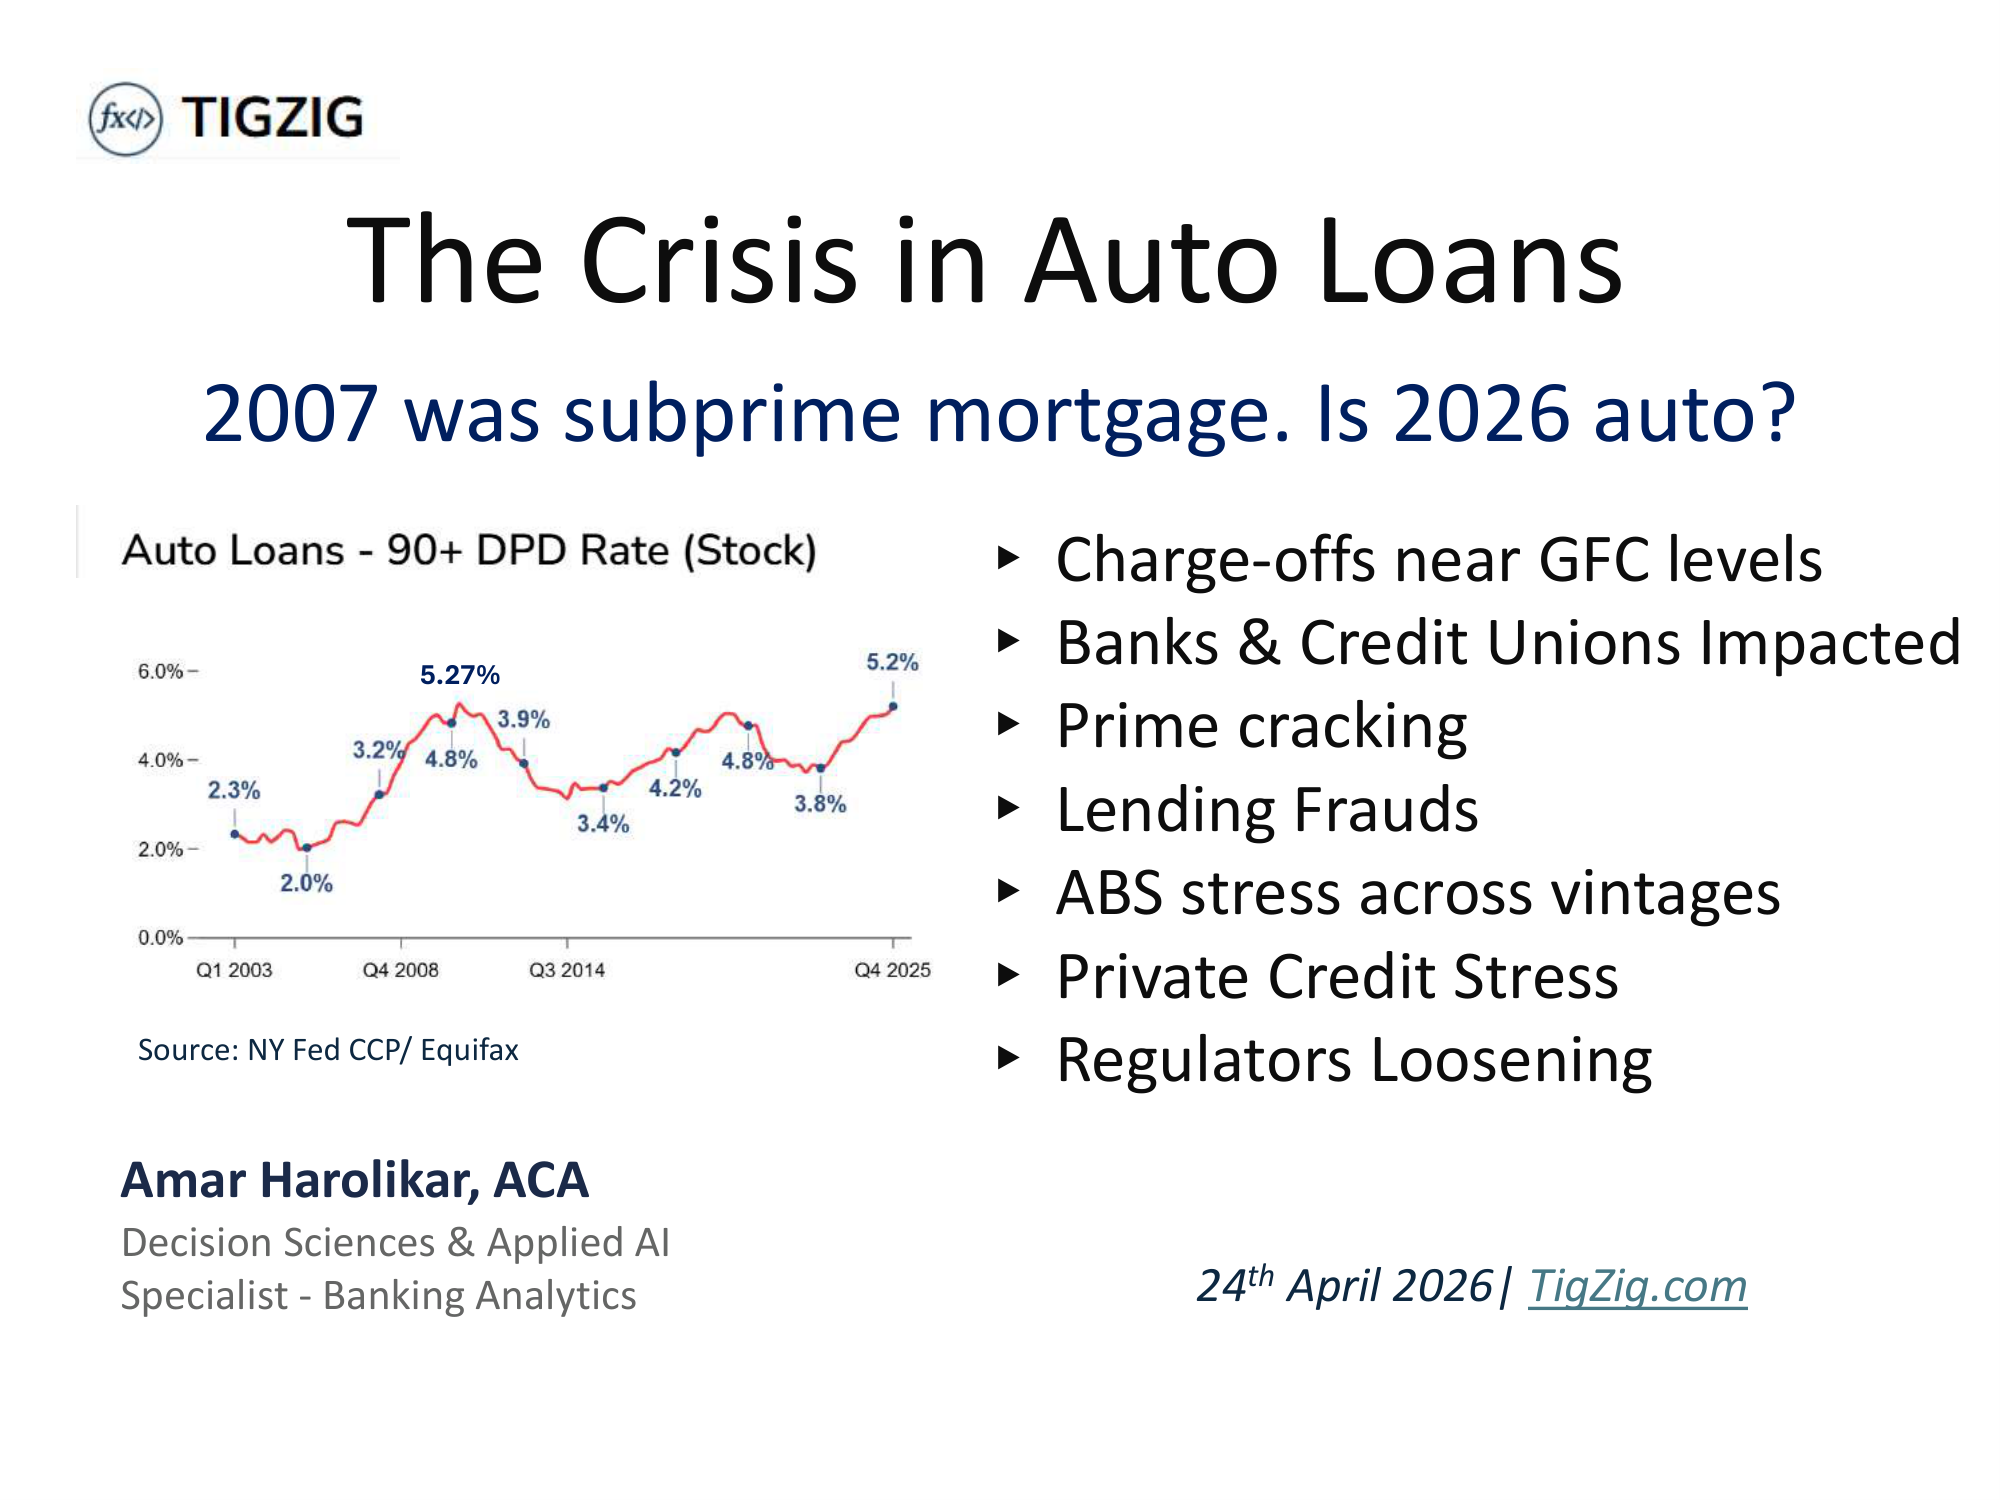
The Crisis in Auto Loans. 2007 was Sub-Prime Mortgage. Is 2026 Auto?
NY Fed Auto 90+DPD at 5.21% vs 5.27% at GFC peak. Bank auto NCO at 2x 2011 baseline. Credit union NCO at 0.95% record high. S&P ABS subprime NCO ~10%. Tricolor fraud $800M. First Brands fraud $2.3B. $1.67T direct exposure plus $350B in ABS. FDIC SDI, NY Fed CCP, NCUA, S&P Global, FFIEC analysis.
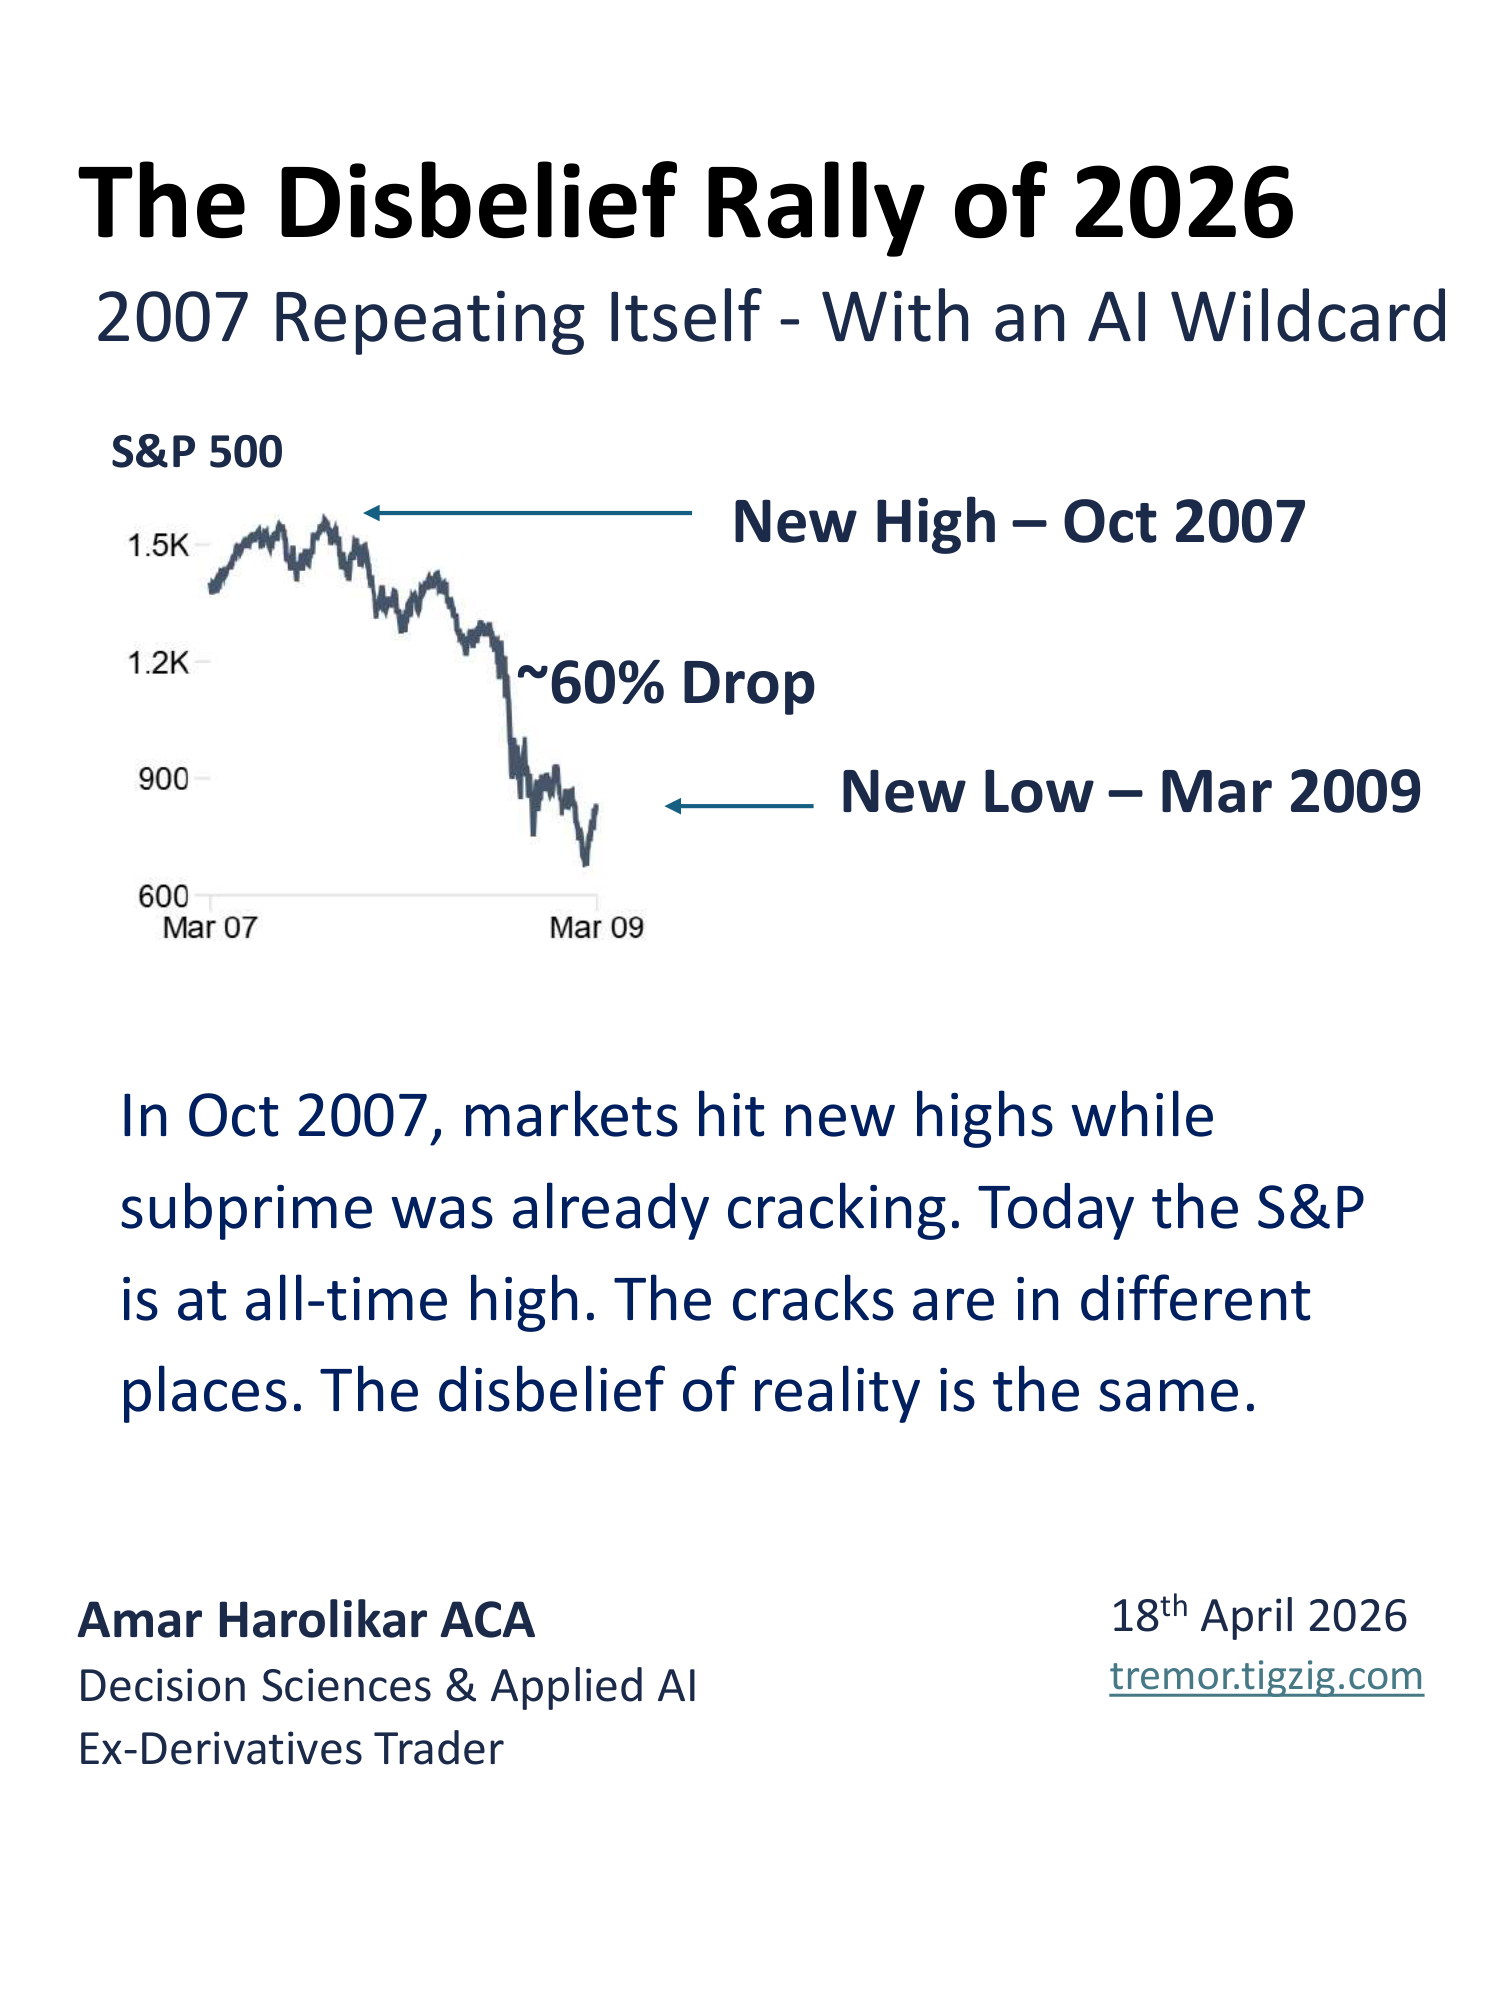
S&P at All-Time High. Under the Hood, Things Are Cracking. Just Like October 2007.
S&P at ATH while private credit at 2x 2007 subprime showing stress. Credit card and auto delinquencies above 2007 pre-crisis. Bank charge-offs higher than 2007. AI displacing workers at unprecedented pace inside a stress cycle. Tracking across FFIEC, FDIC, NY Fed, IEA, Challenger, Anthropic Economic Index.
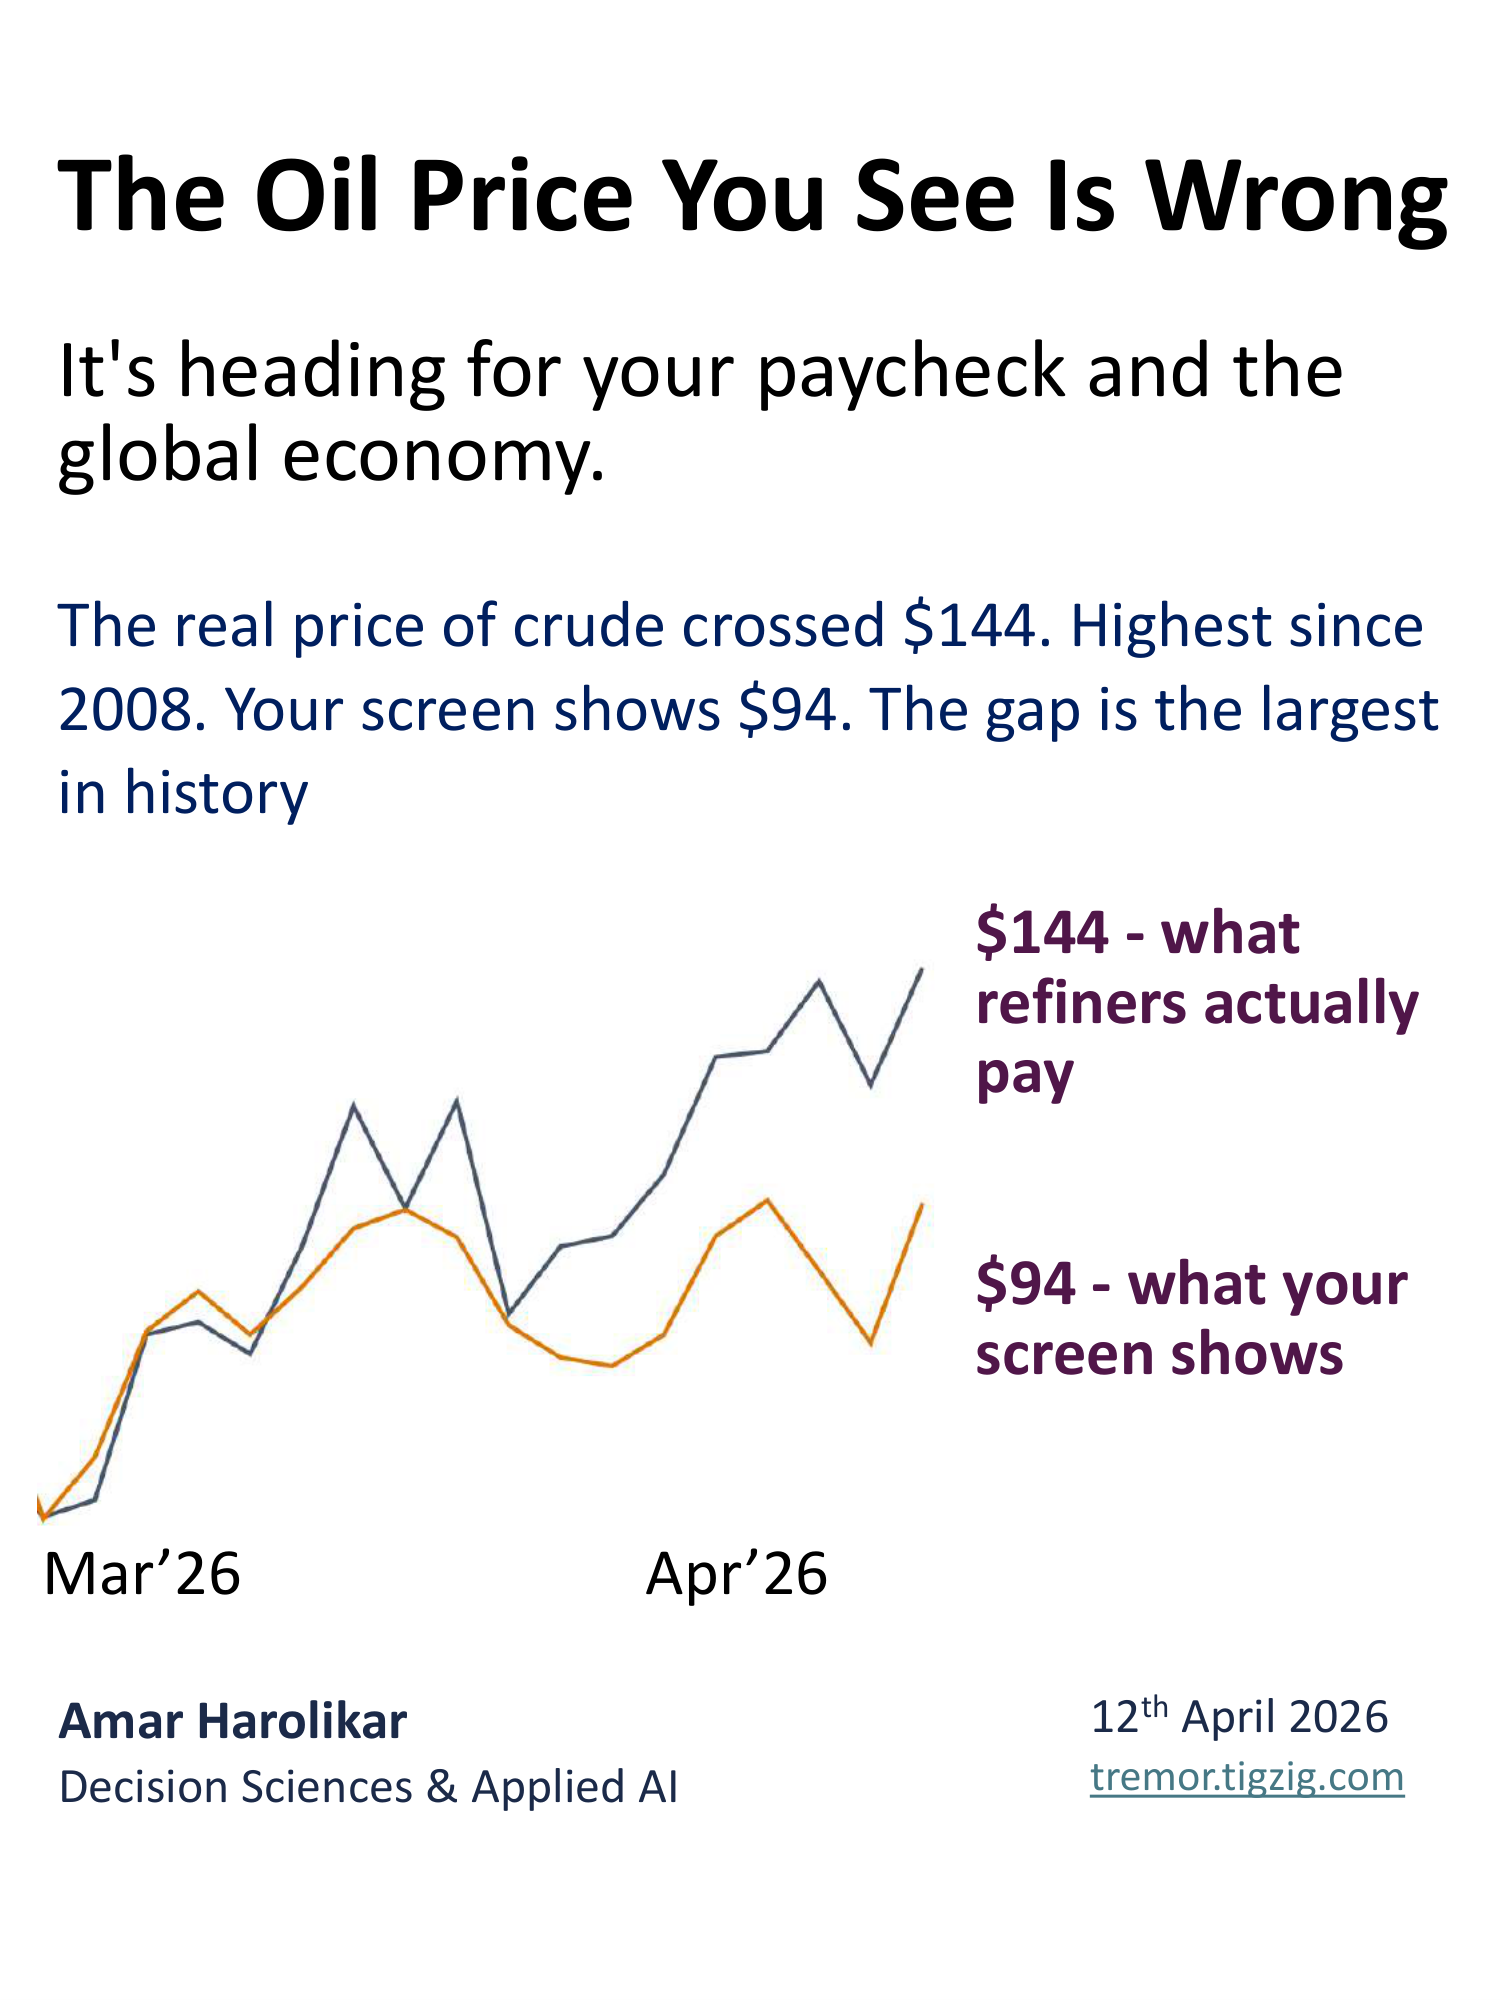
The Masking Effect in Oil Markets - The Price You See on Screens Is Hiding a $50 Supply Shock
Largest spot-futures divergence in oil market history. Brent futures at $94, physical crude at $144. Analysis of 9,864 trading days since 1987. 40 bids vs 4 offers in North Sea. Diesel near $200/bbl. US gasoline inventories at 16-year lows. Hormuz shut 40 days, Kuwait says 3-4 months to restore.
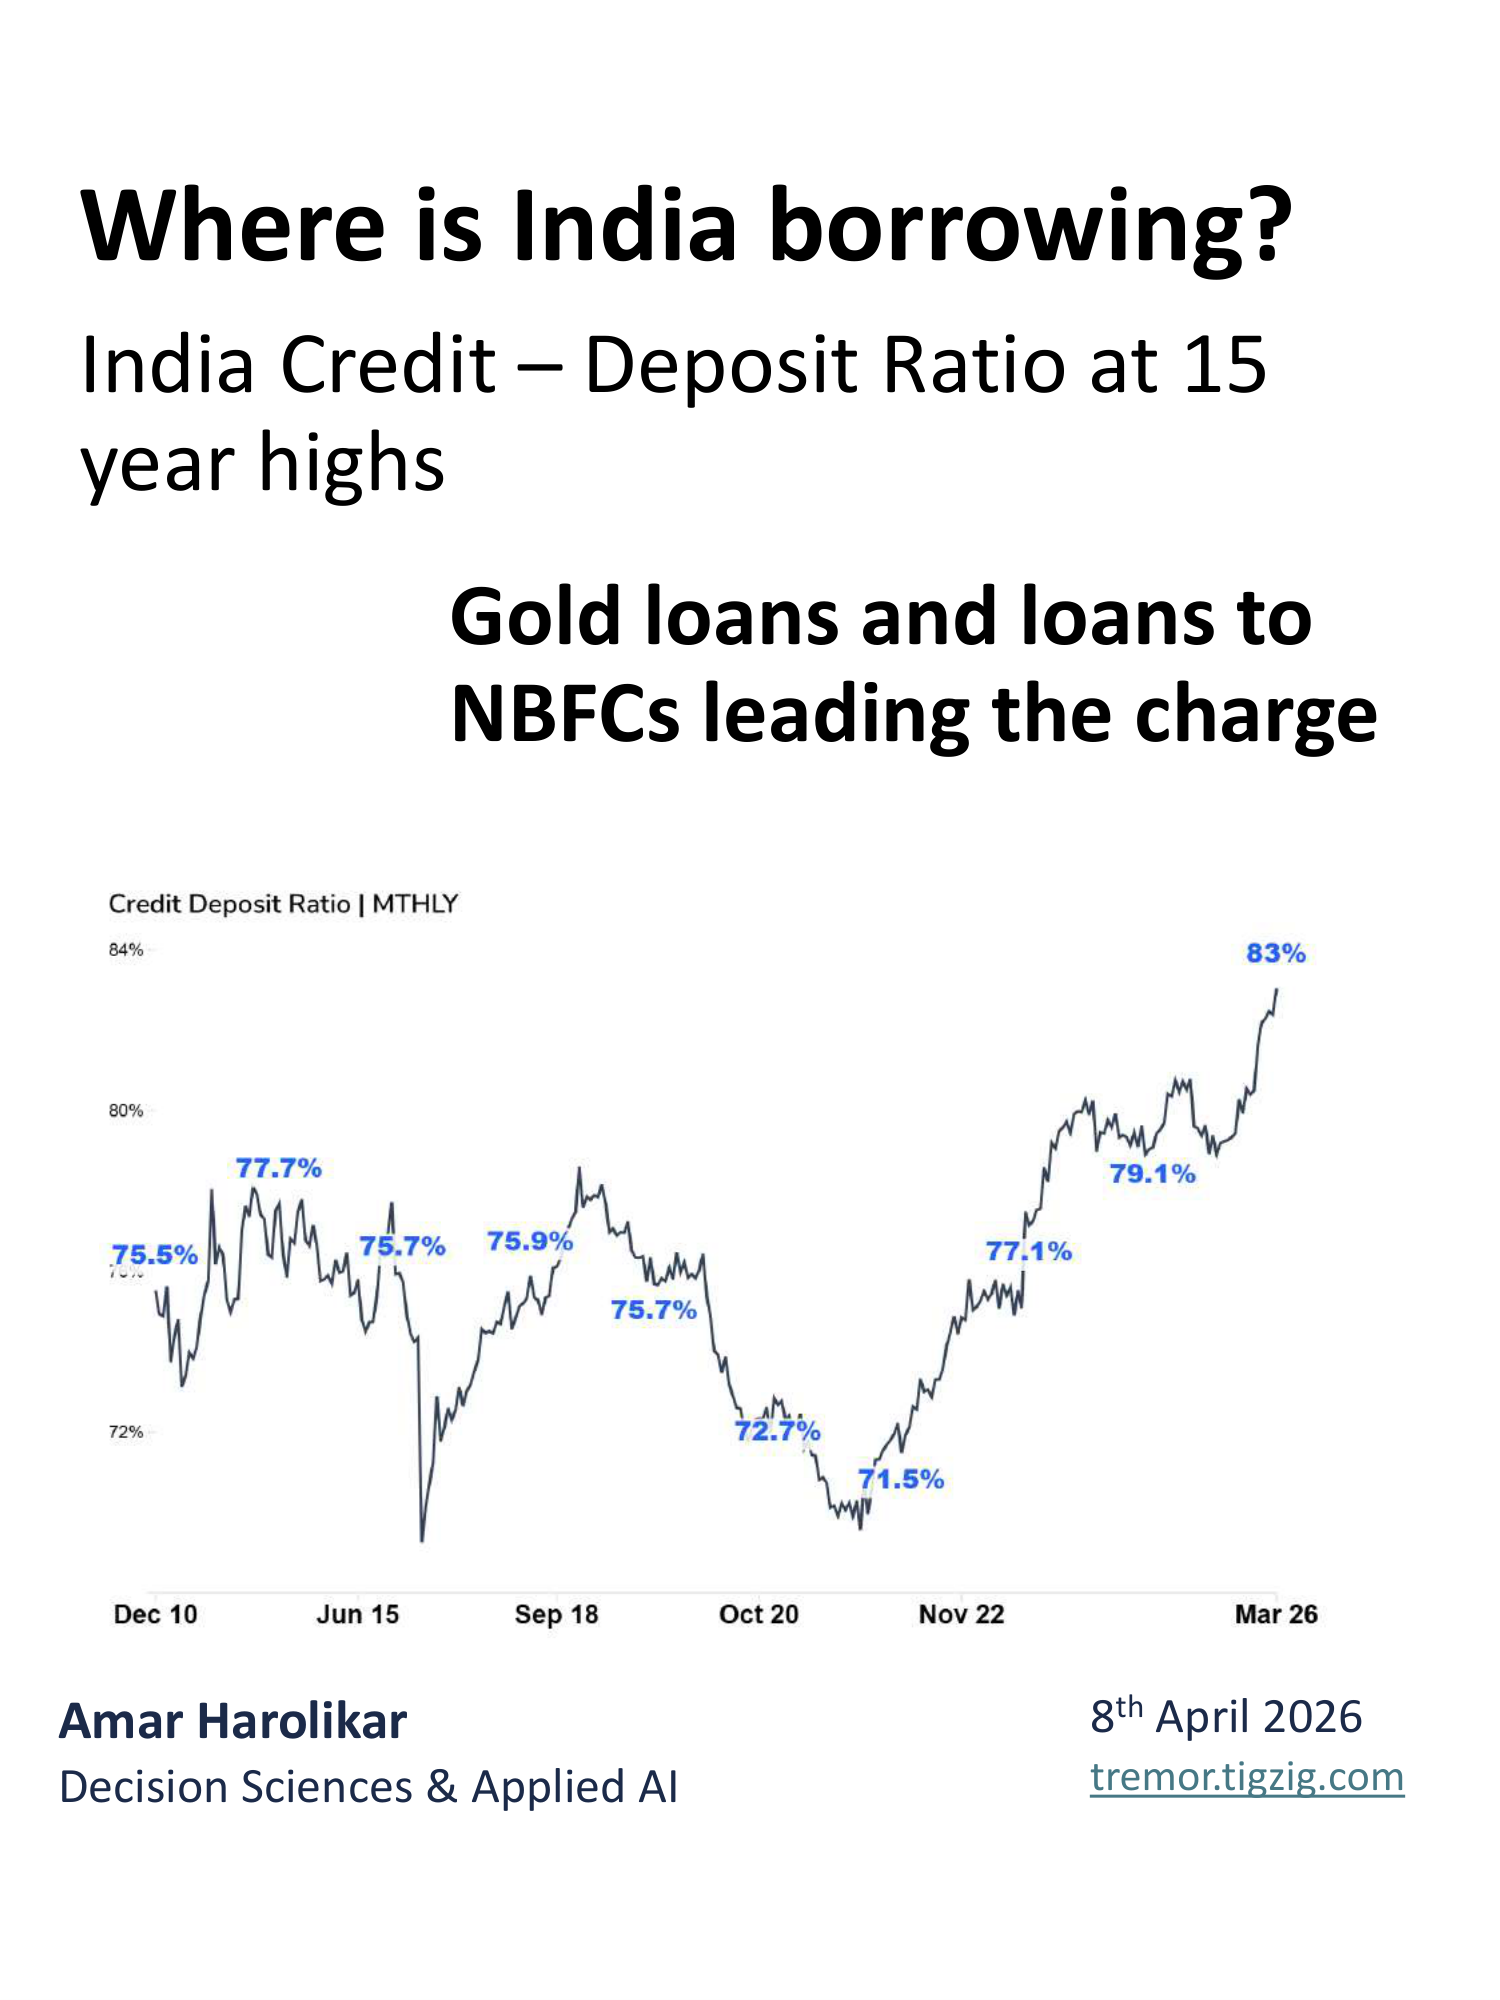
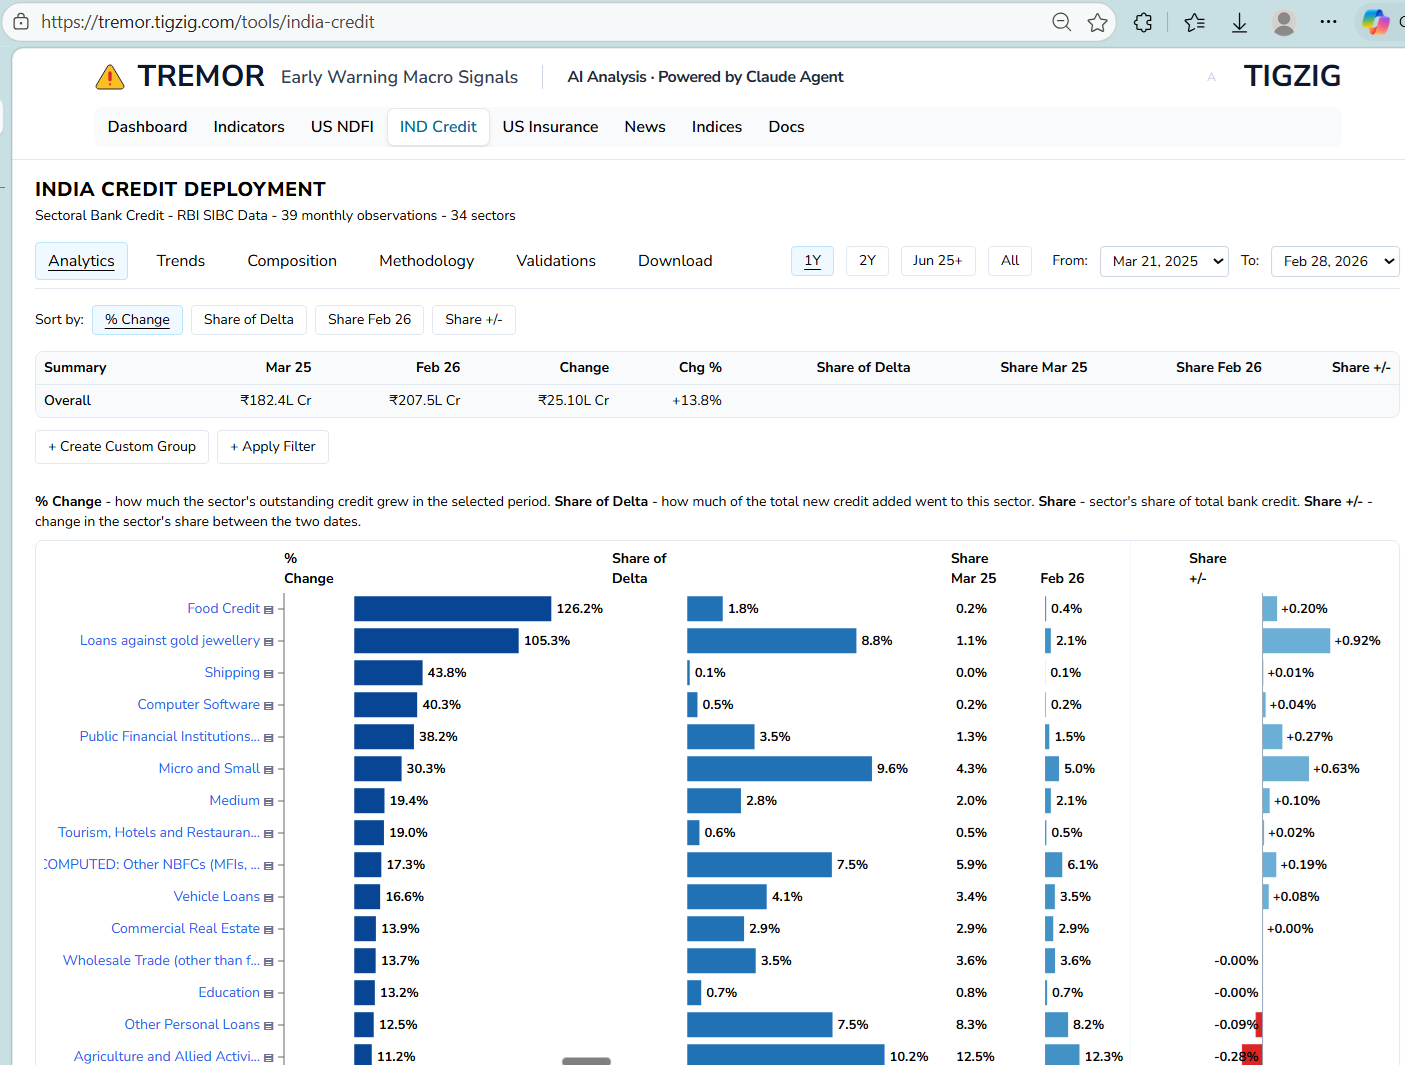
India's Credit-Deposit Ratio Just Hit 83%. A 15-Year High. Gold Loans Up 4x in Two Years.
India credit-deposit ratio at 83%, 15-year high. Gold loans up 4x in two years. NBFC loans up 21% in 9 months. Six sectors growing at 2x overall rate pulling one-third of new credit. Credit grew 12.3% vs deposits 9%. Housing growth slowed. RBI sectoral data analysis.
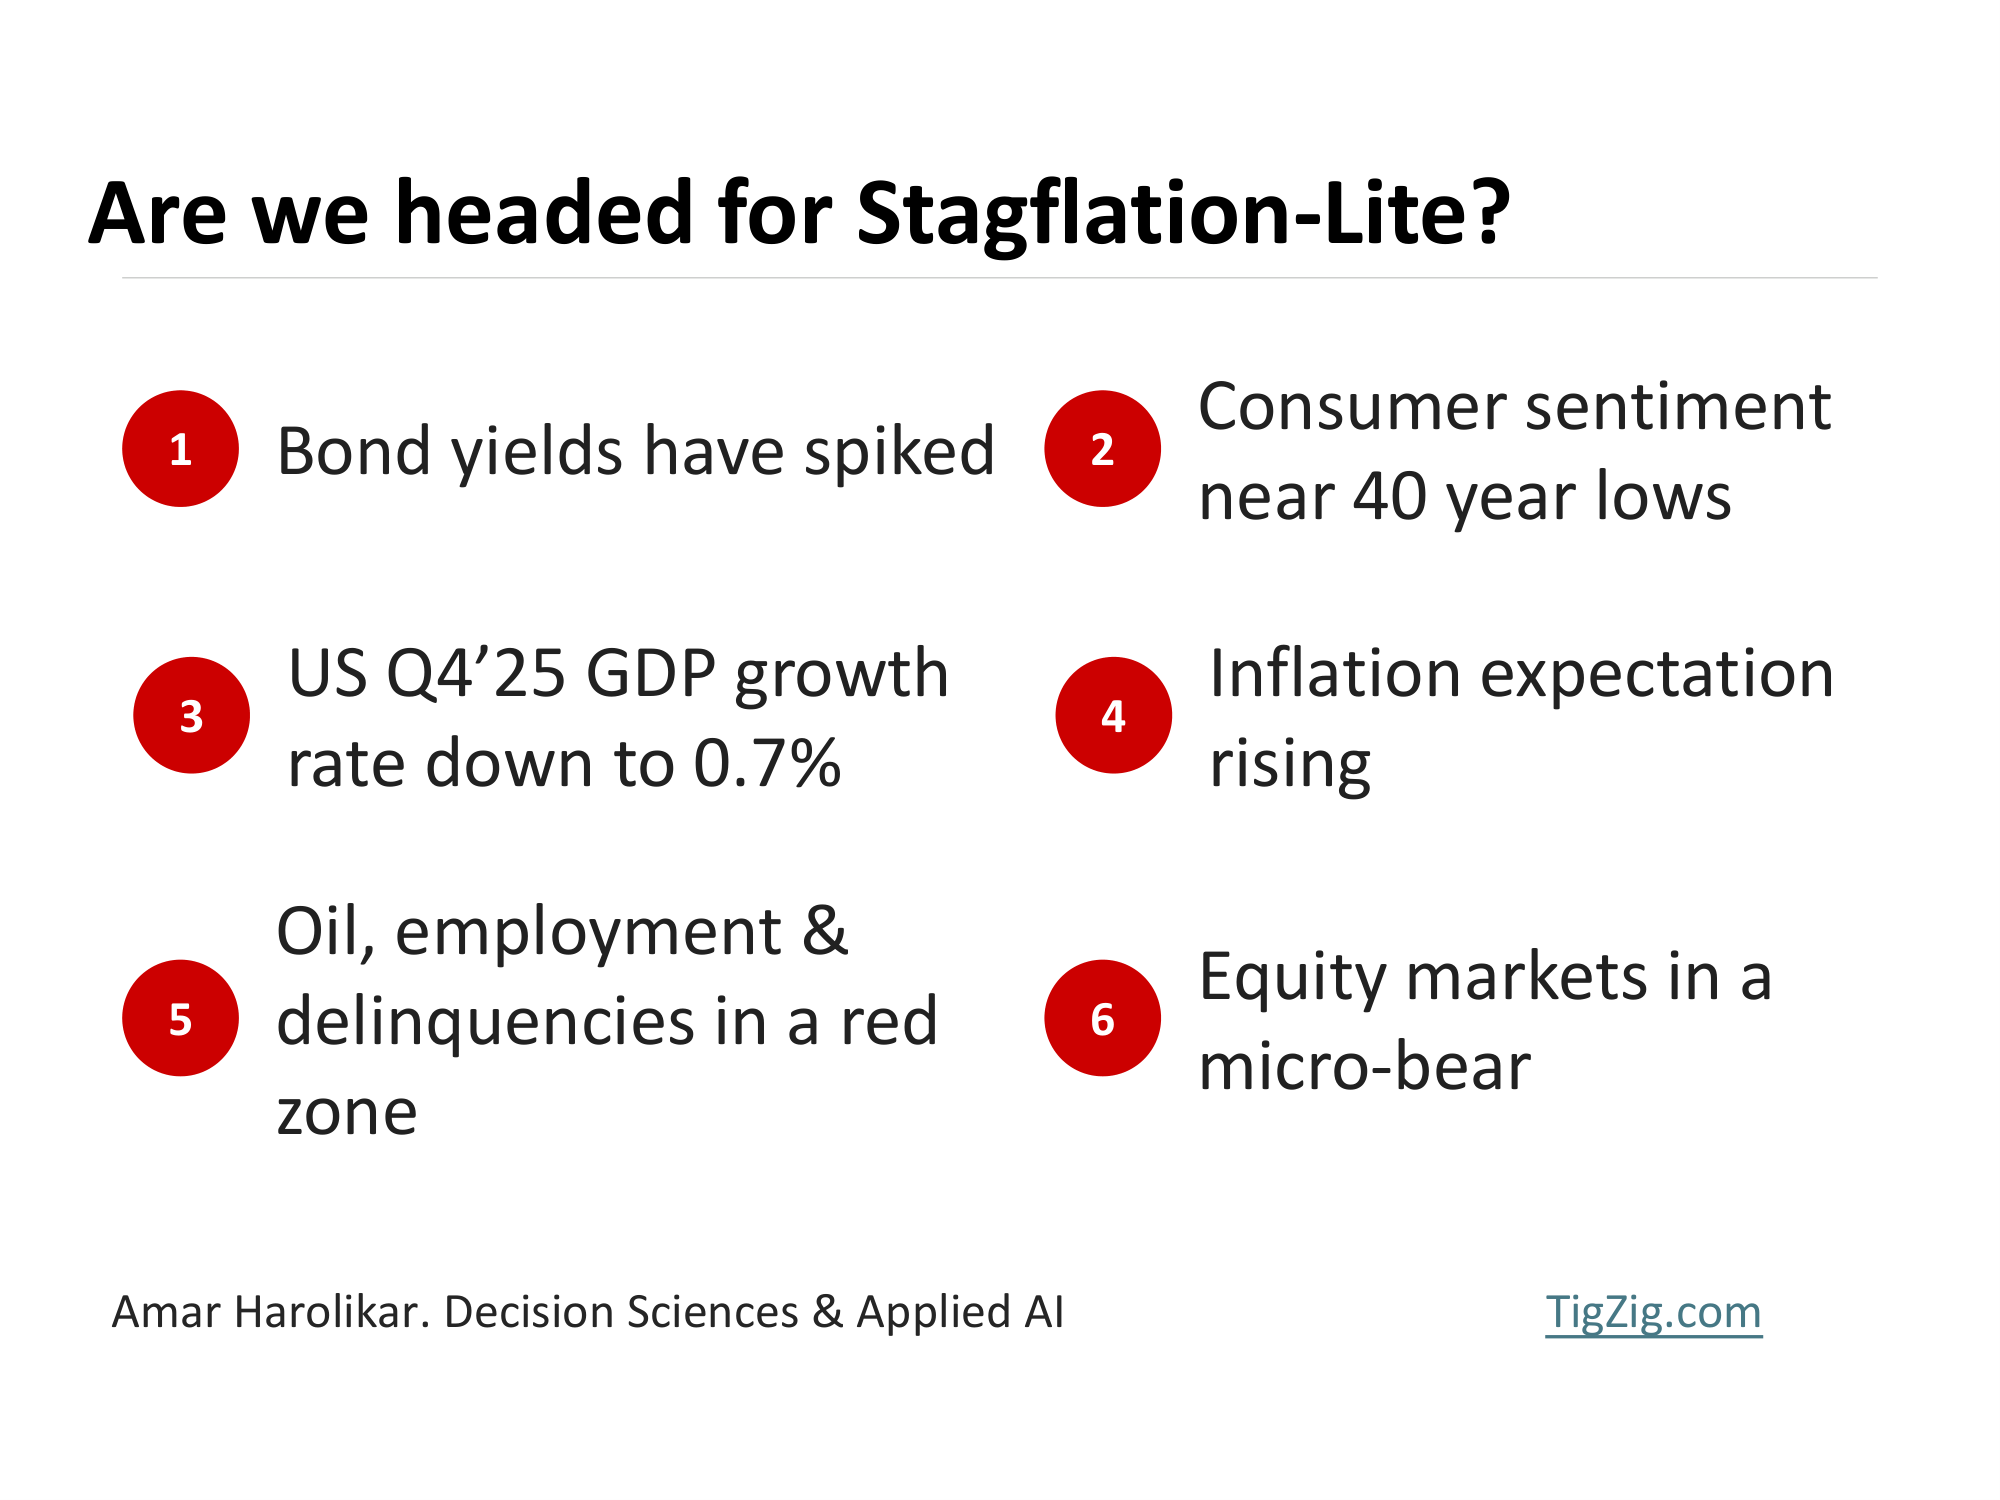
Are We Headed for Stagflation-Lite
Stagflation-Lite signals intensifying. Fed trapped between inflation and weak jobs. US 10Y at 4.4%, PPI at 3.4% with oil shock not yet in data, GDP at 0.7%, consumer sentiment 7th lowest in 40 years, Moody recession odds at 48.6%. Bond markets pricing in high inflation globally.
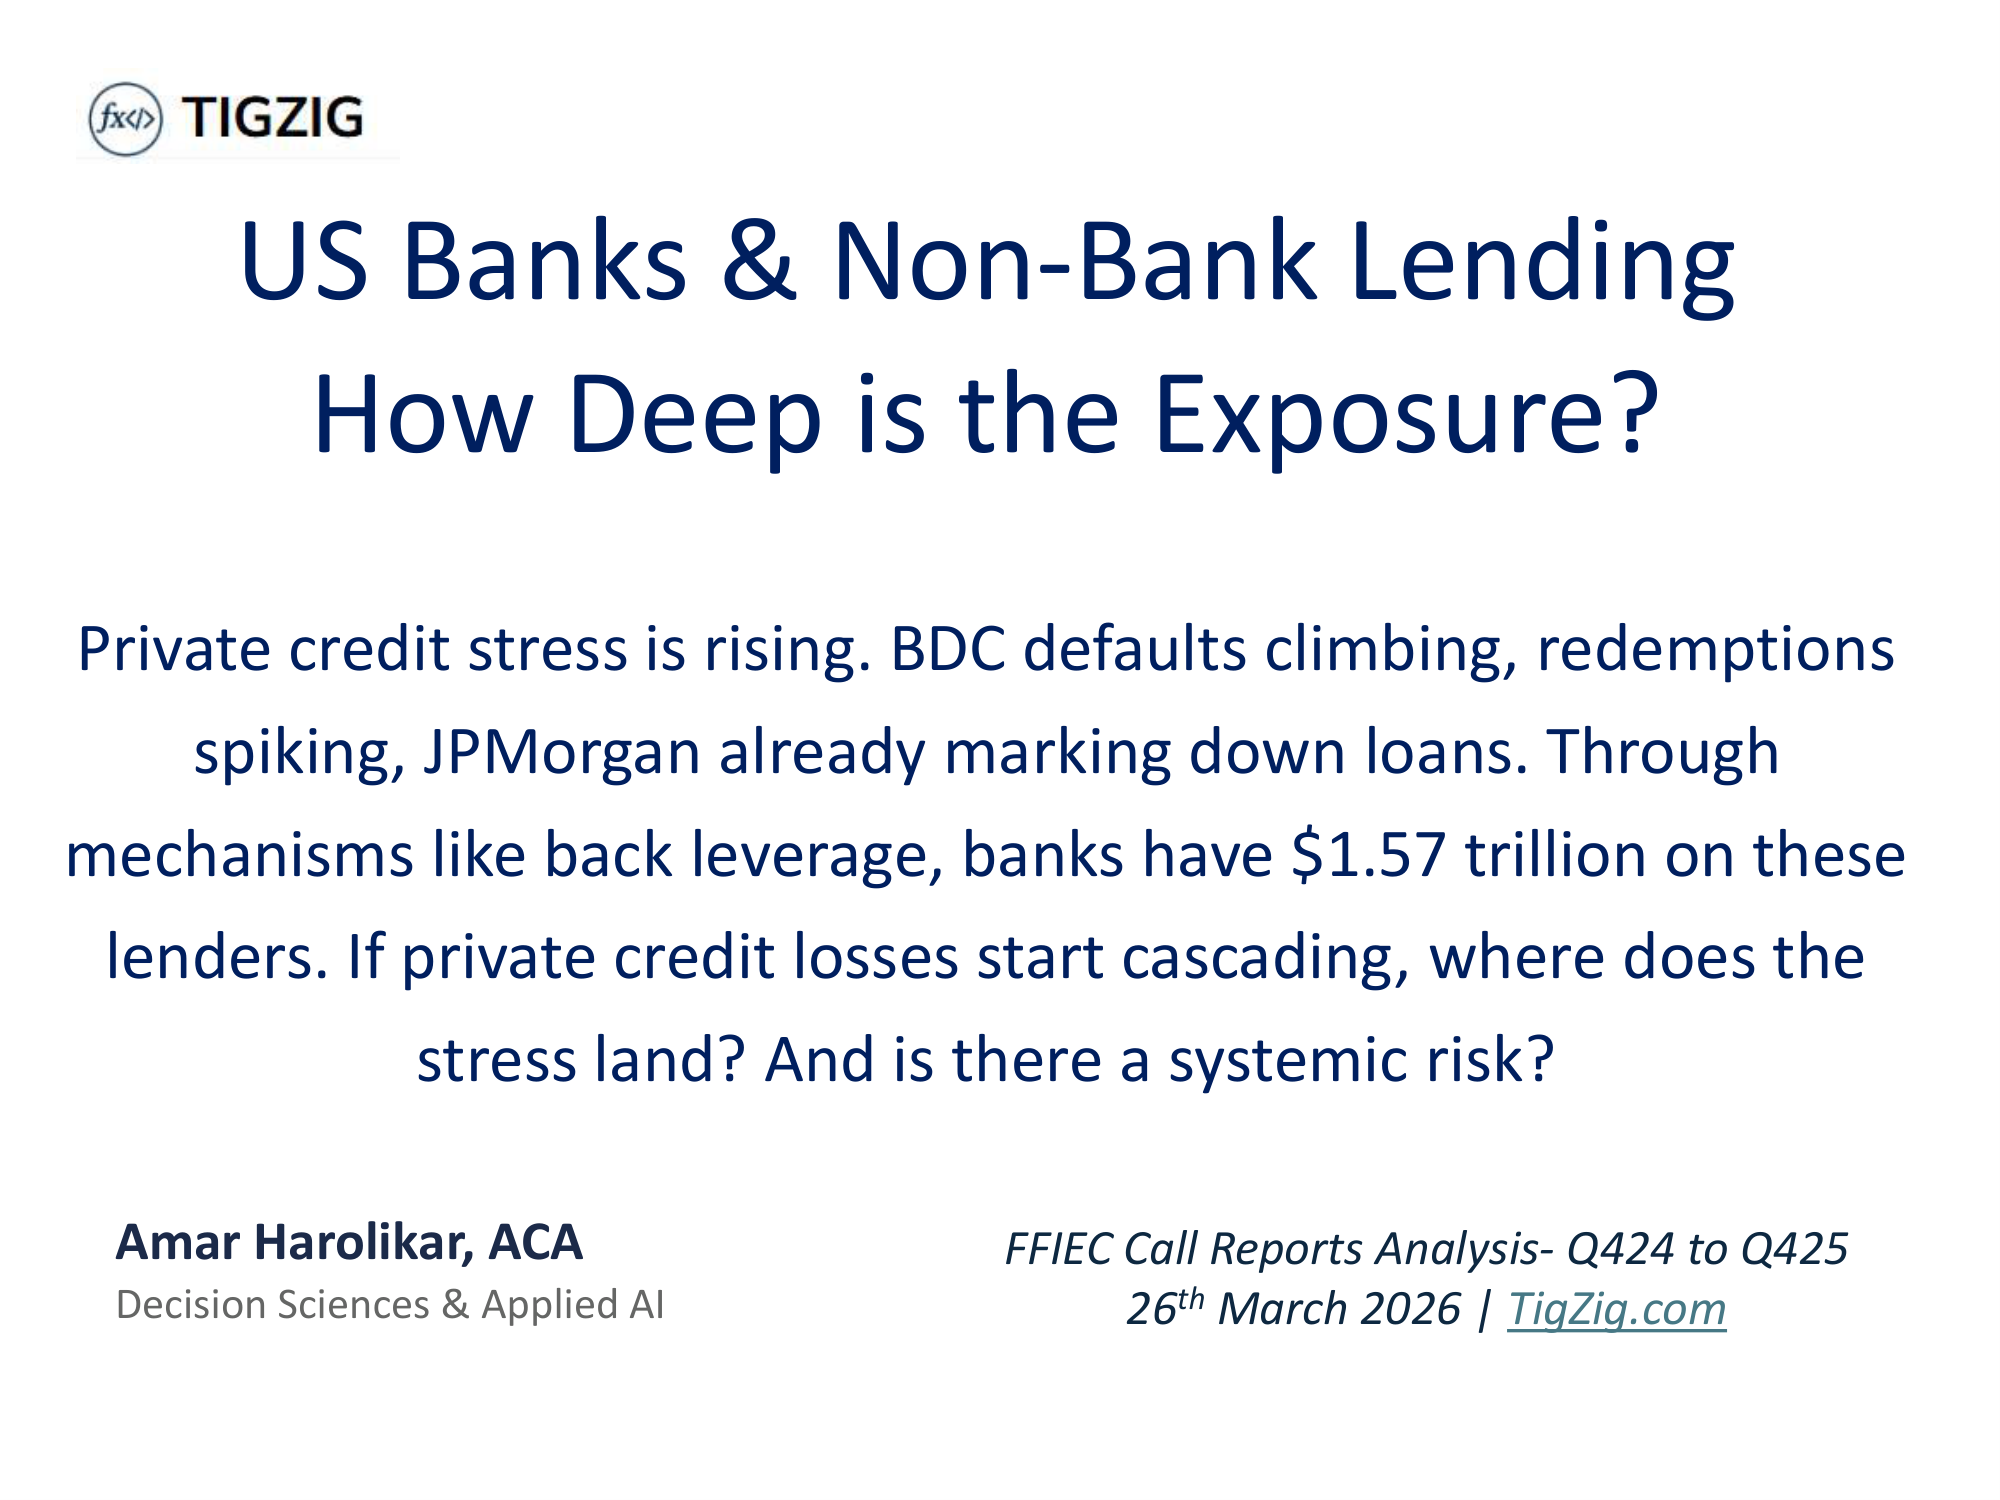
US Banks & Non-Bank Lending - How Deep is the Exposure? Is there a Systemic Risk?
US banks hold $1.57 trillion in loans to non-bank lenders facing redemptions and defaults. 41 banks have this single portfolio exceeding 100% of core capital. 62 banks have loan loss reserves covering less than 10% of exposure. Analysis from FFIEC Call Reports for 629 banks across 5 quarters, cross-validated against FDIC, FRED and S&P Global.
Private Credit - The $2.7 Trillion Shadow Lending Market Is Showing Cracks
Private credit showing cracks that remind Wall Street of 2008. Jamie Dimon and Lloyd Blankfein flagging risks. 40% of borrowers have negative cash flow. Blackstone scrambled to meet $3.8B in redemptions. Management companies down 30-50% in 6 months.
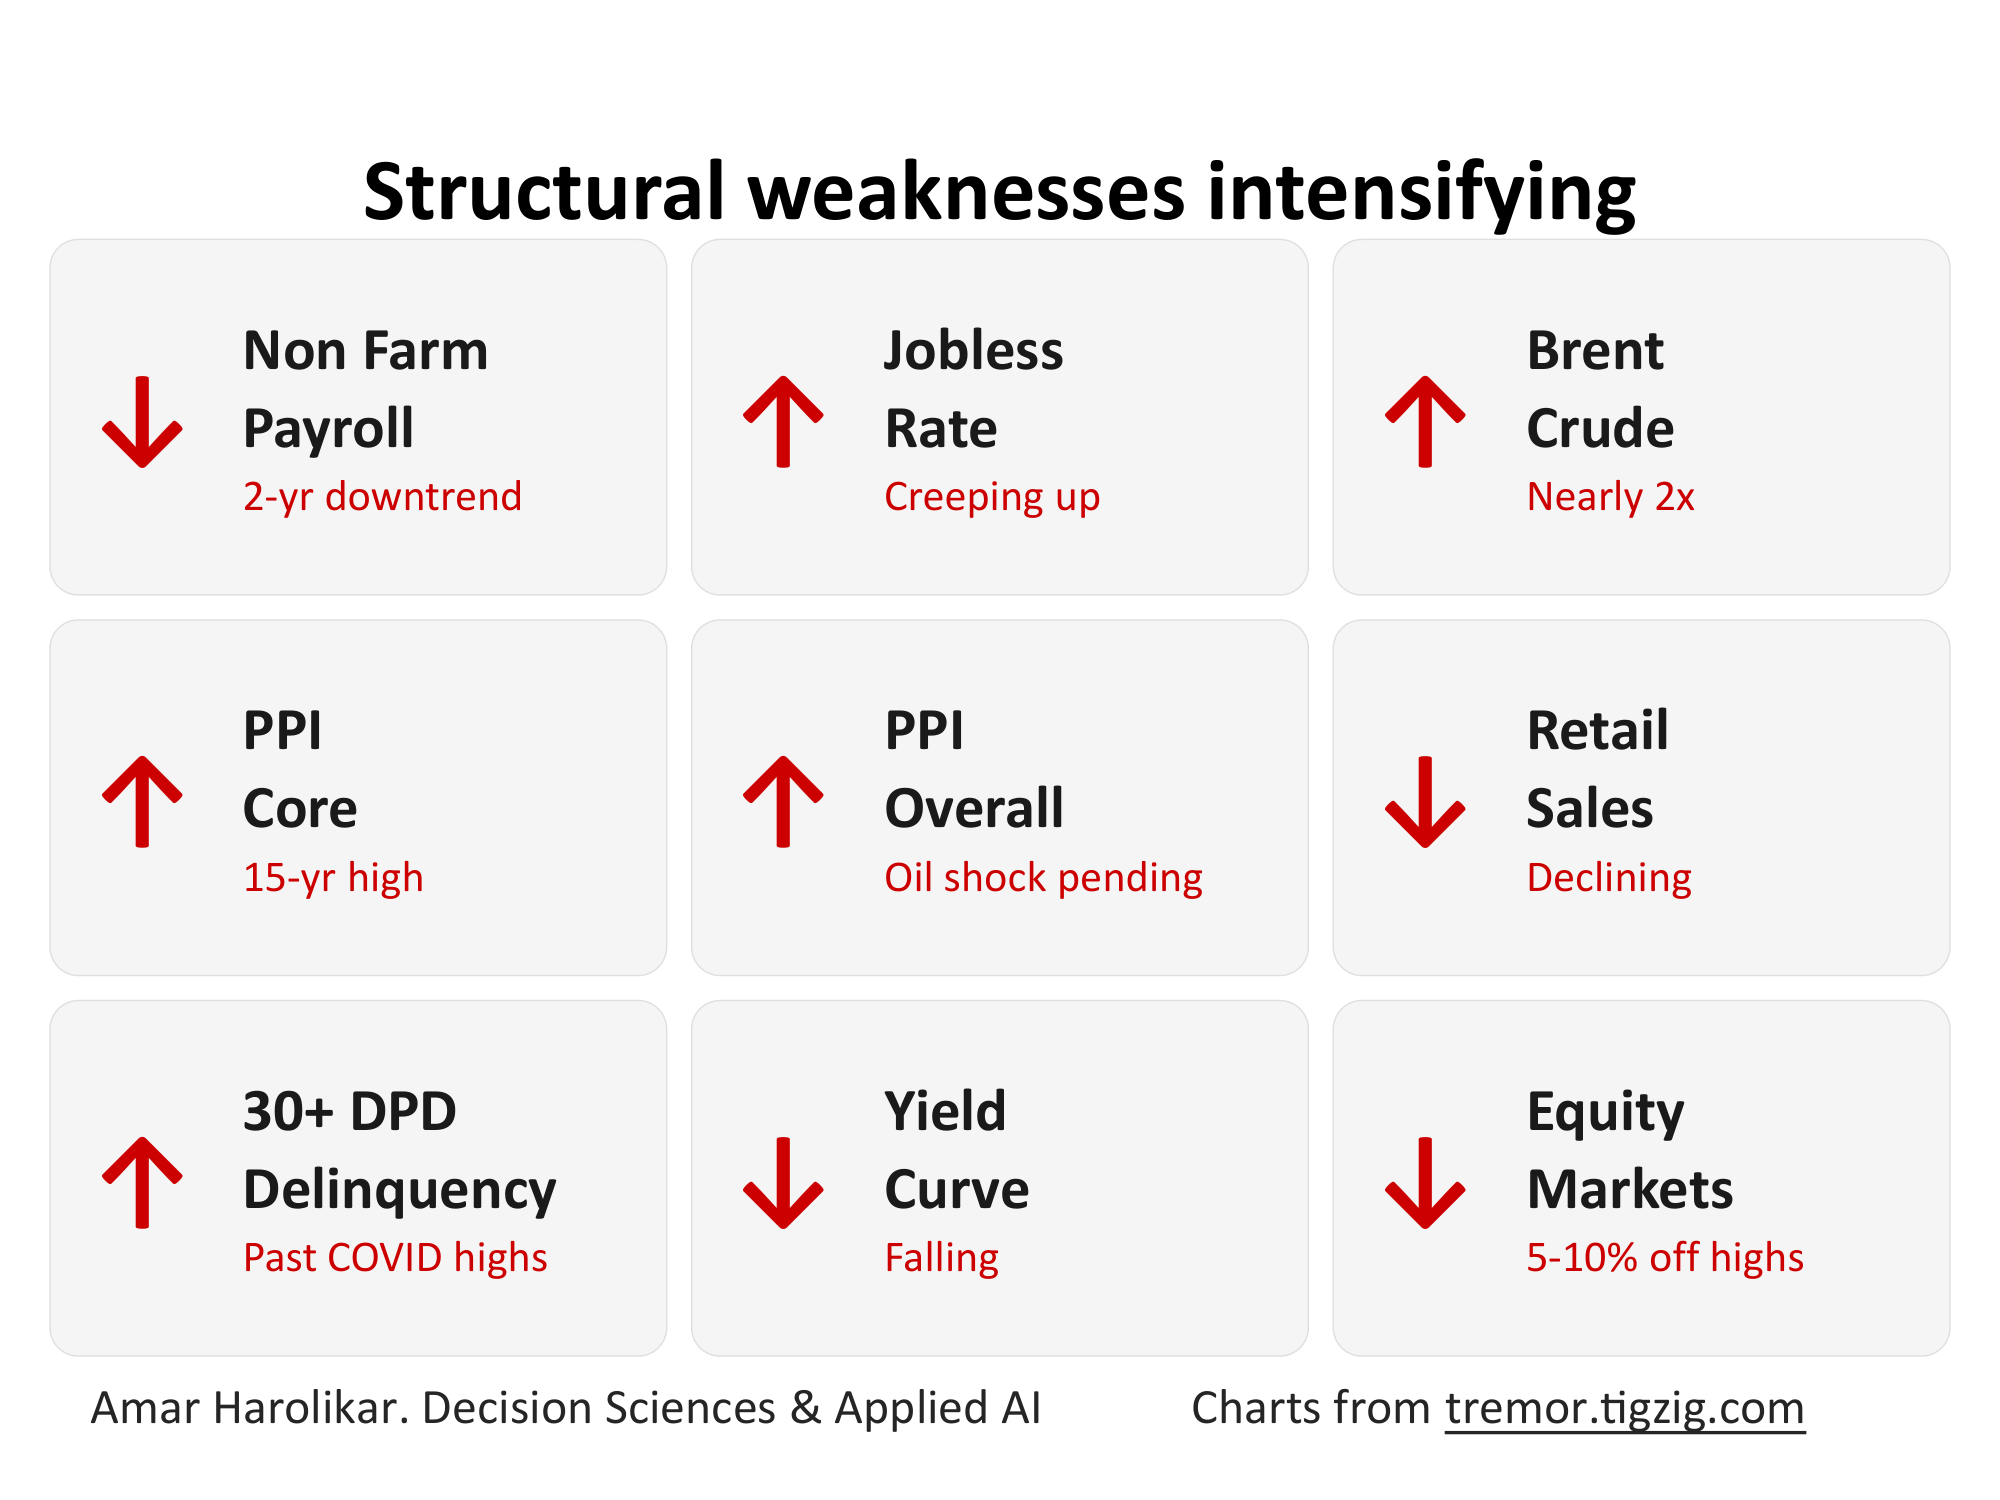
Structural Weakness Intensifying
3 major US macro data points in 3 days all pointing the same direction. Feb payrolls minus 92K against expectations of 59K rise. PPI Core at 3.87%. Fed held at 3.5-3.75%. Brent crude nearly doubled in 3 months. Delinquencies past COVID highs. Multiple macro signals flashing stress simultaneously.
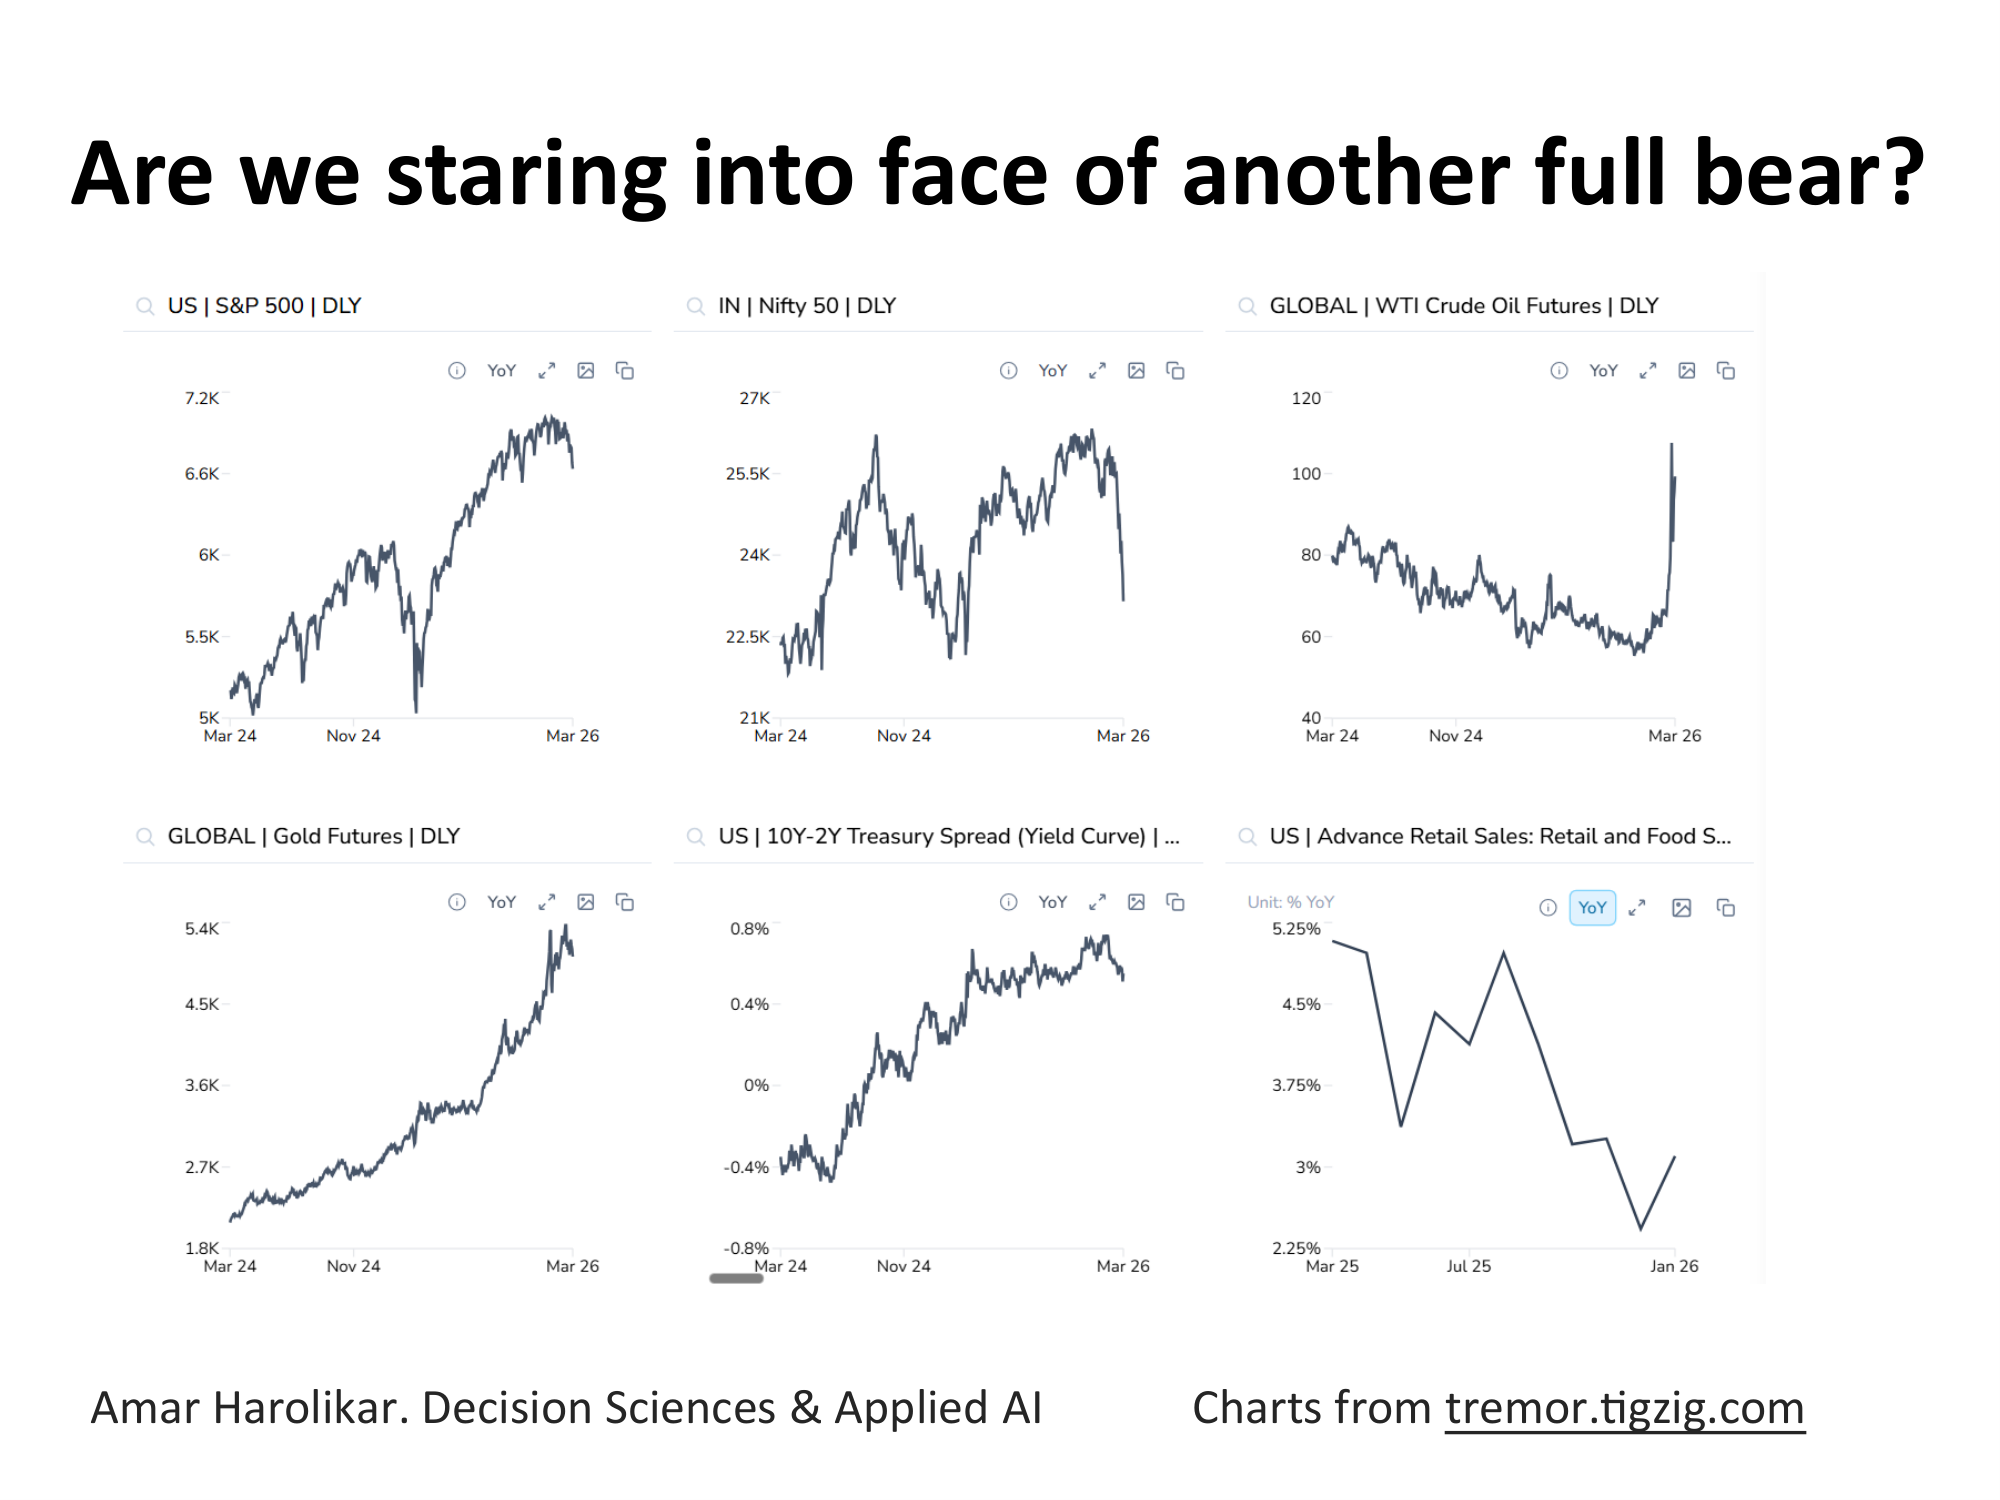
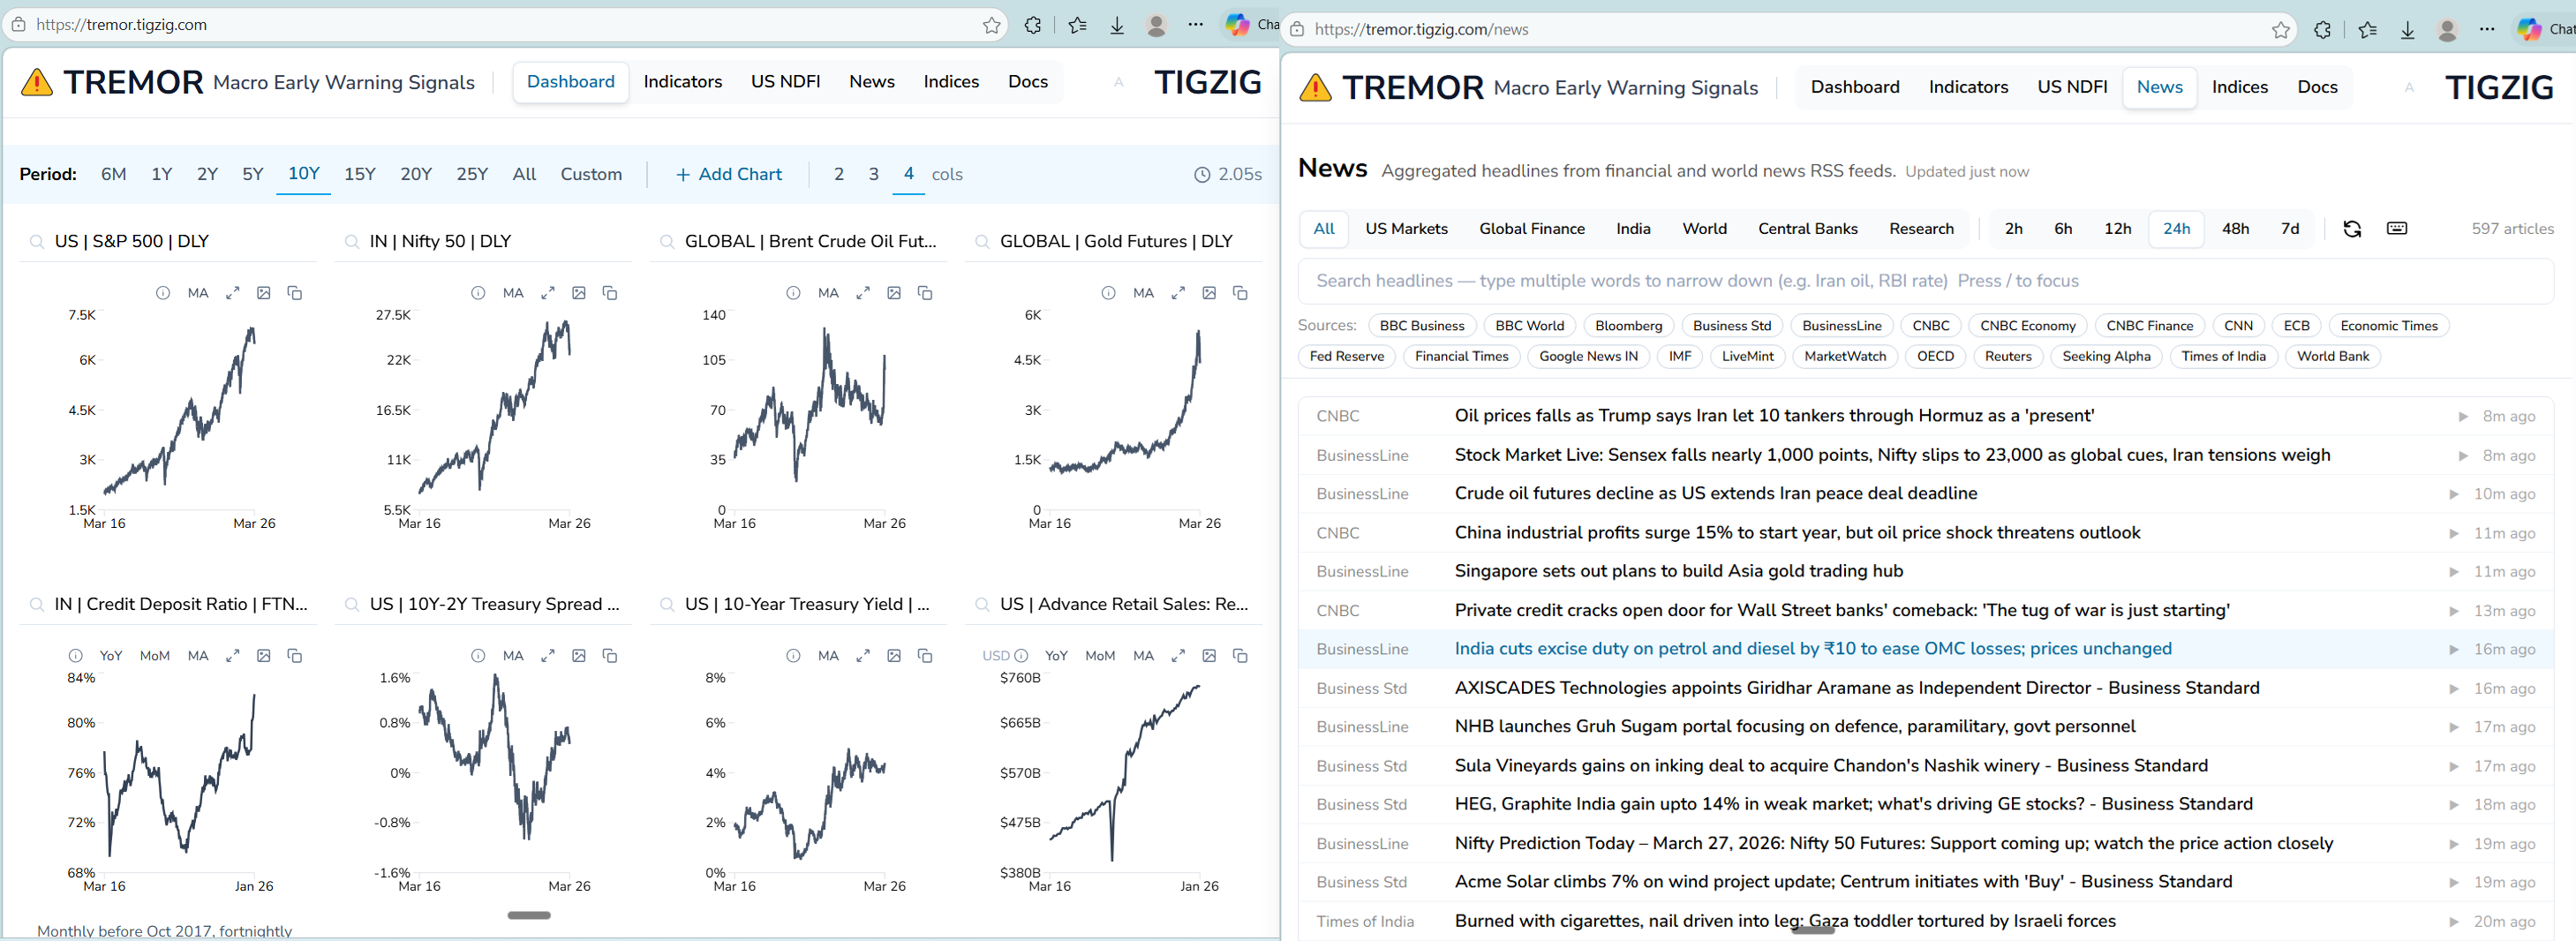
Tremor - Macro Early Warning Signals - March 2026
S&P down 5%, Nifty in bear territory down 12% from highs. CAPE at 40-year highs, gold going vertical, crude shooting towards 2008 levels, US delinquencies crossing COVID highs. When macro signals move together - tremors before a quake. 12 chart slides from tremor.tigzig.com.
Tool & Data Releases
27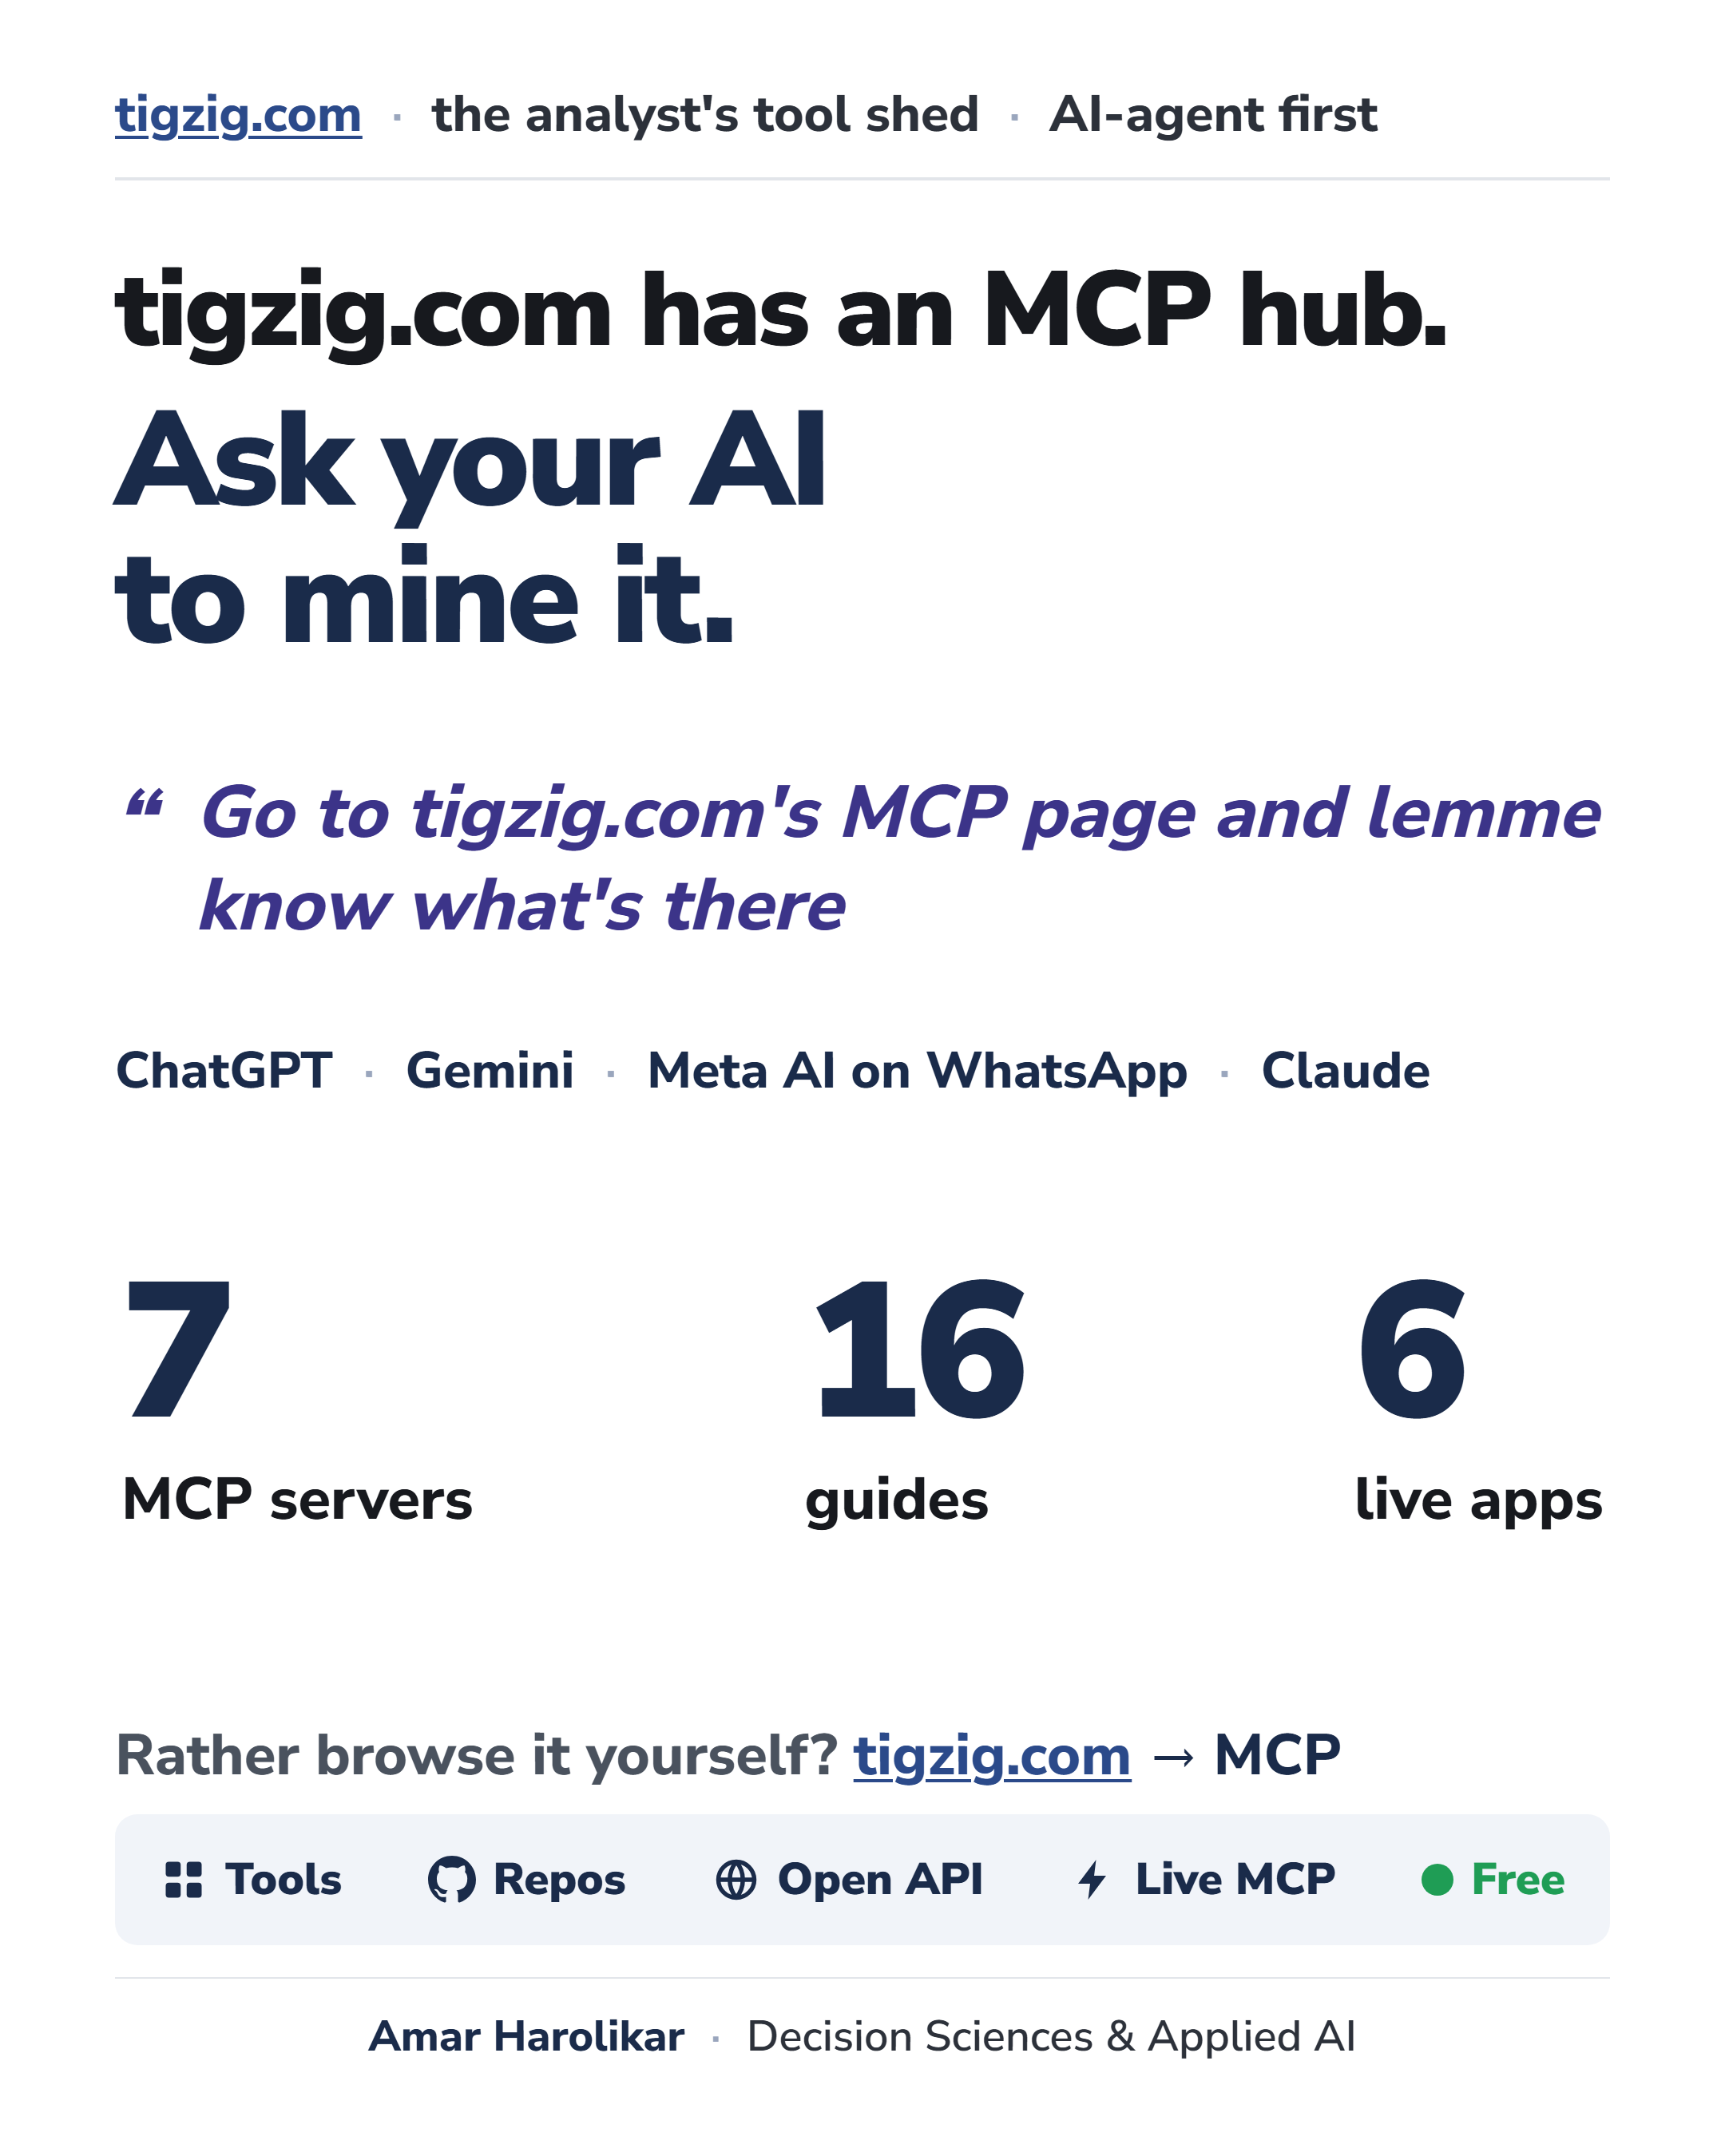
New MCP Hub on Tigzig.com - 7 MCP Servers, 6 Live Apps, 16 Guides, 108-Point Security Checklist. Just Ask Your AI.

Stop Browsing Tigzig.com. Ask ChatGPT First. (Or Whichever AI You Use.)
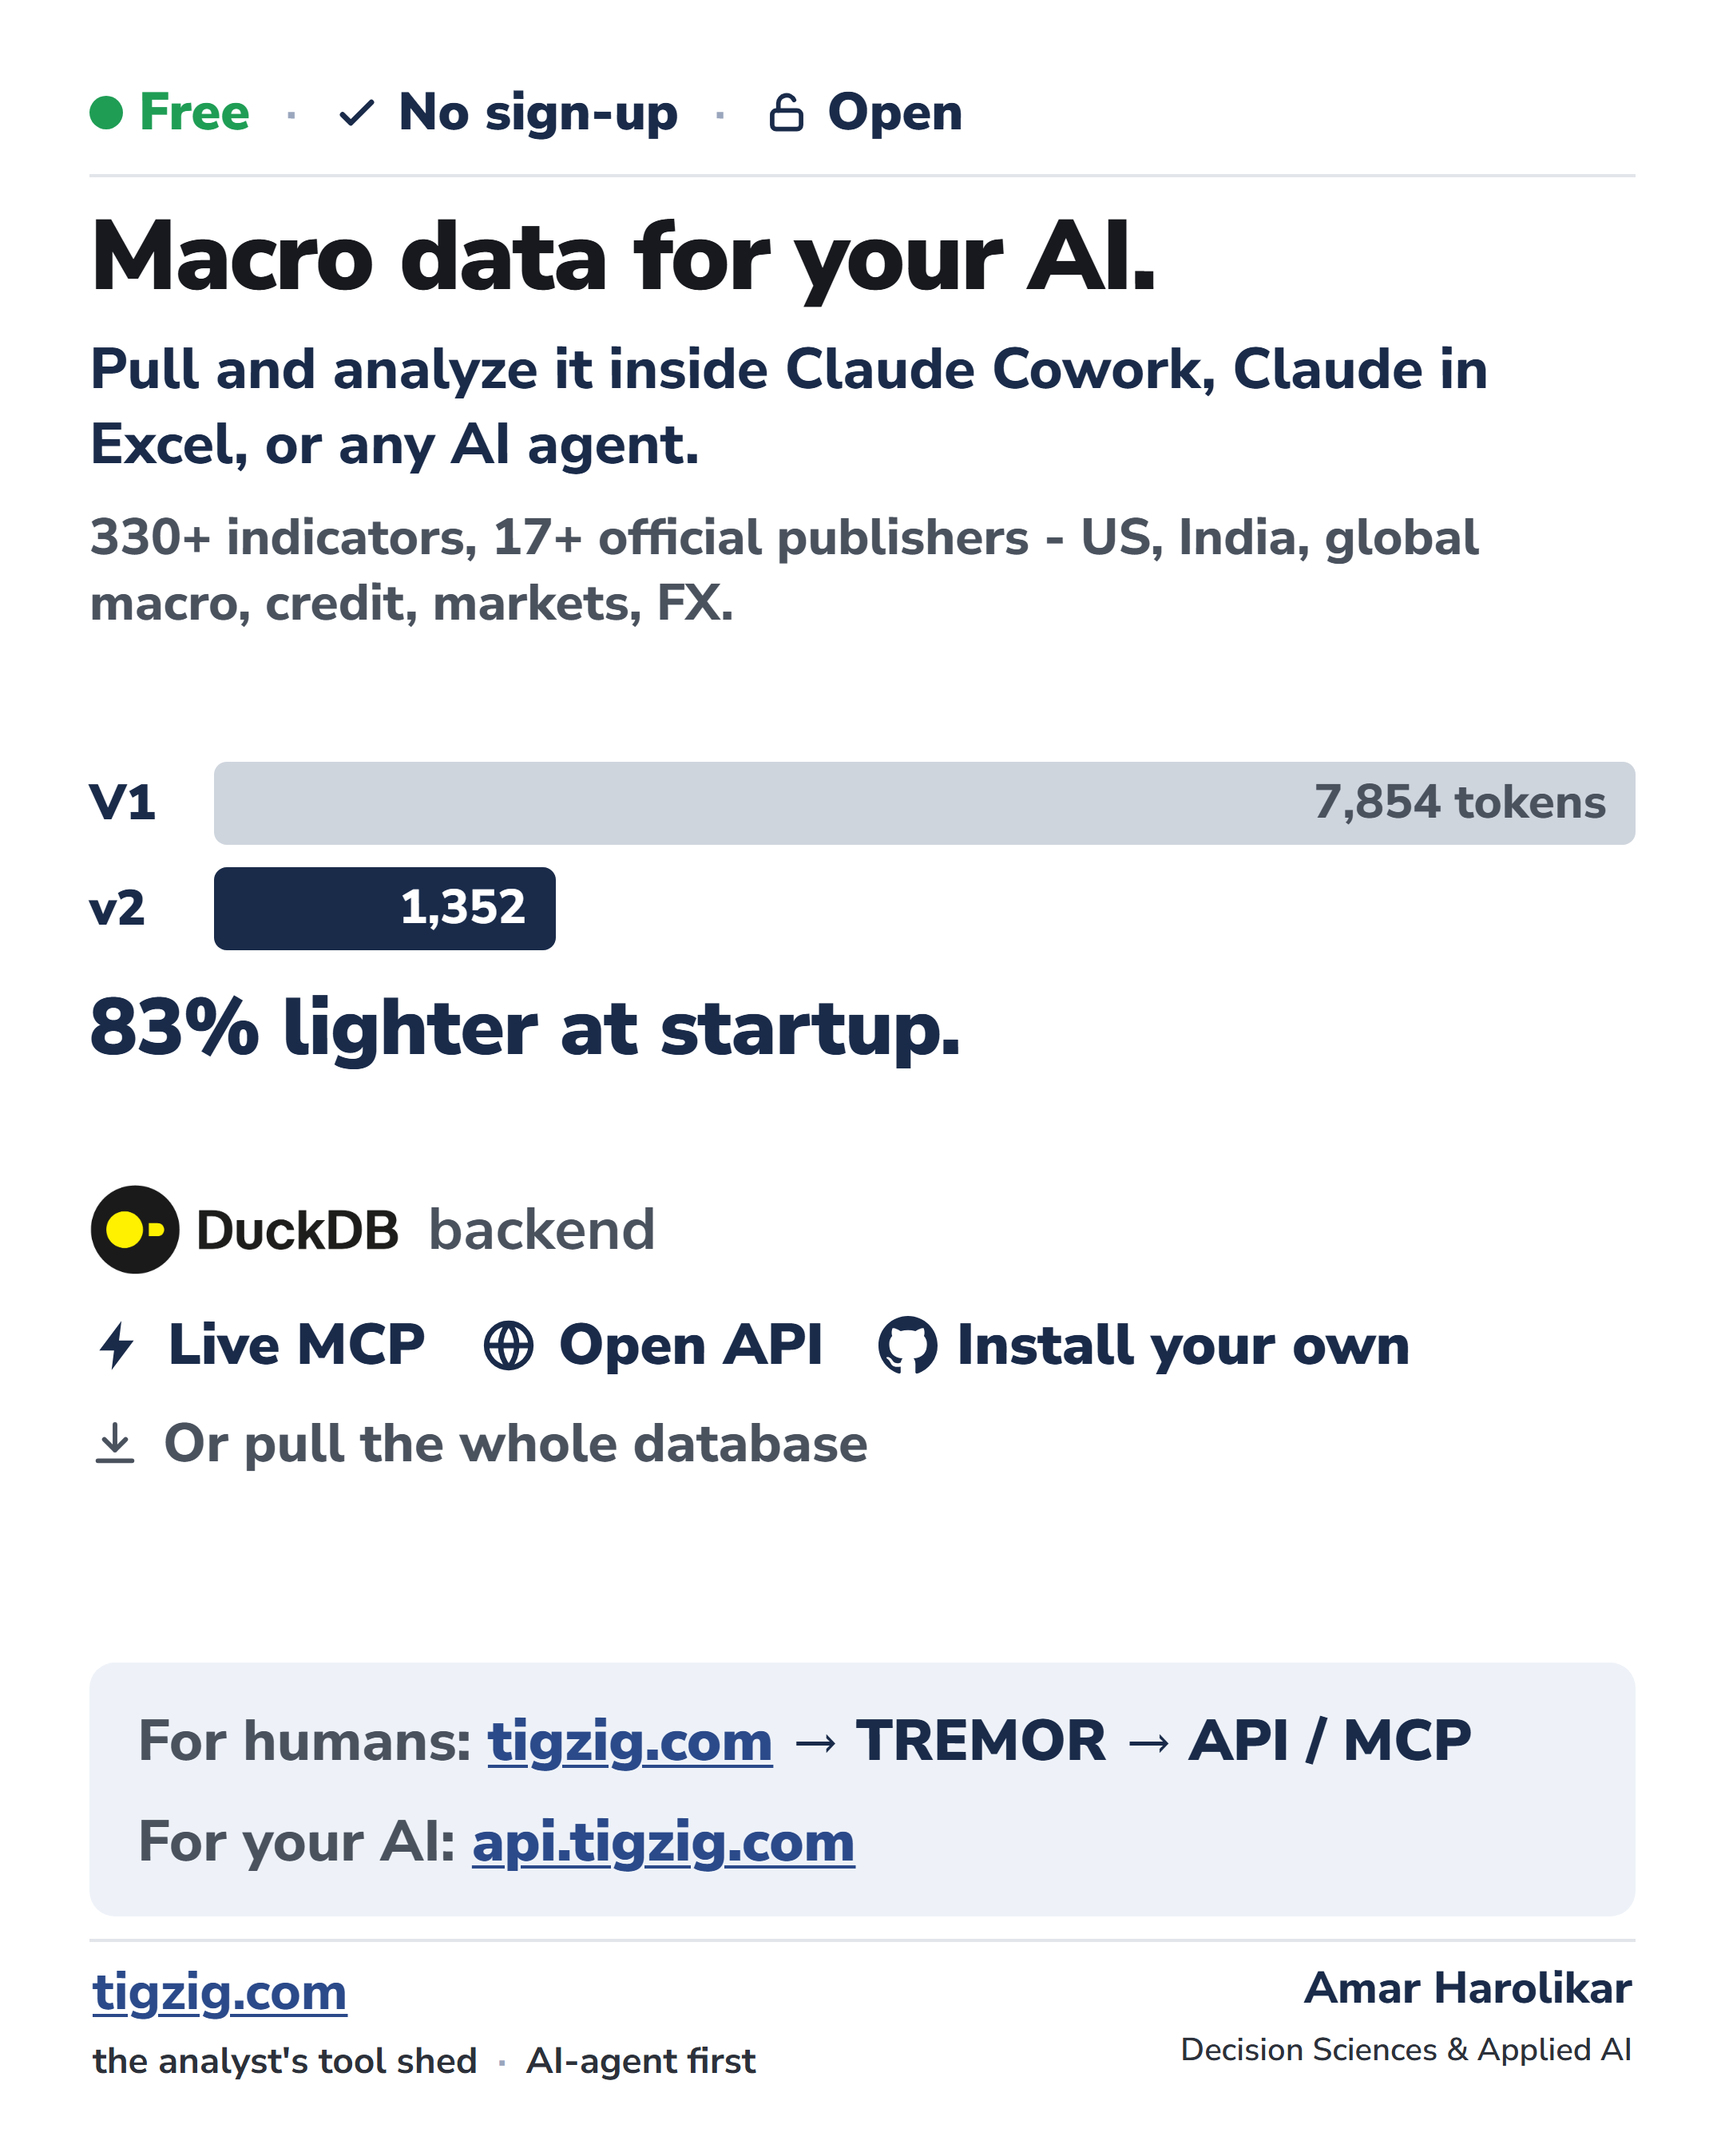
Tigzig Tremor v2 Is Live. 330+ Macro + Credit Indicators Behind an MCP. 83% Lighter Startup. Just Ask Your AI Agent.
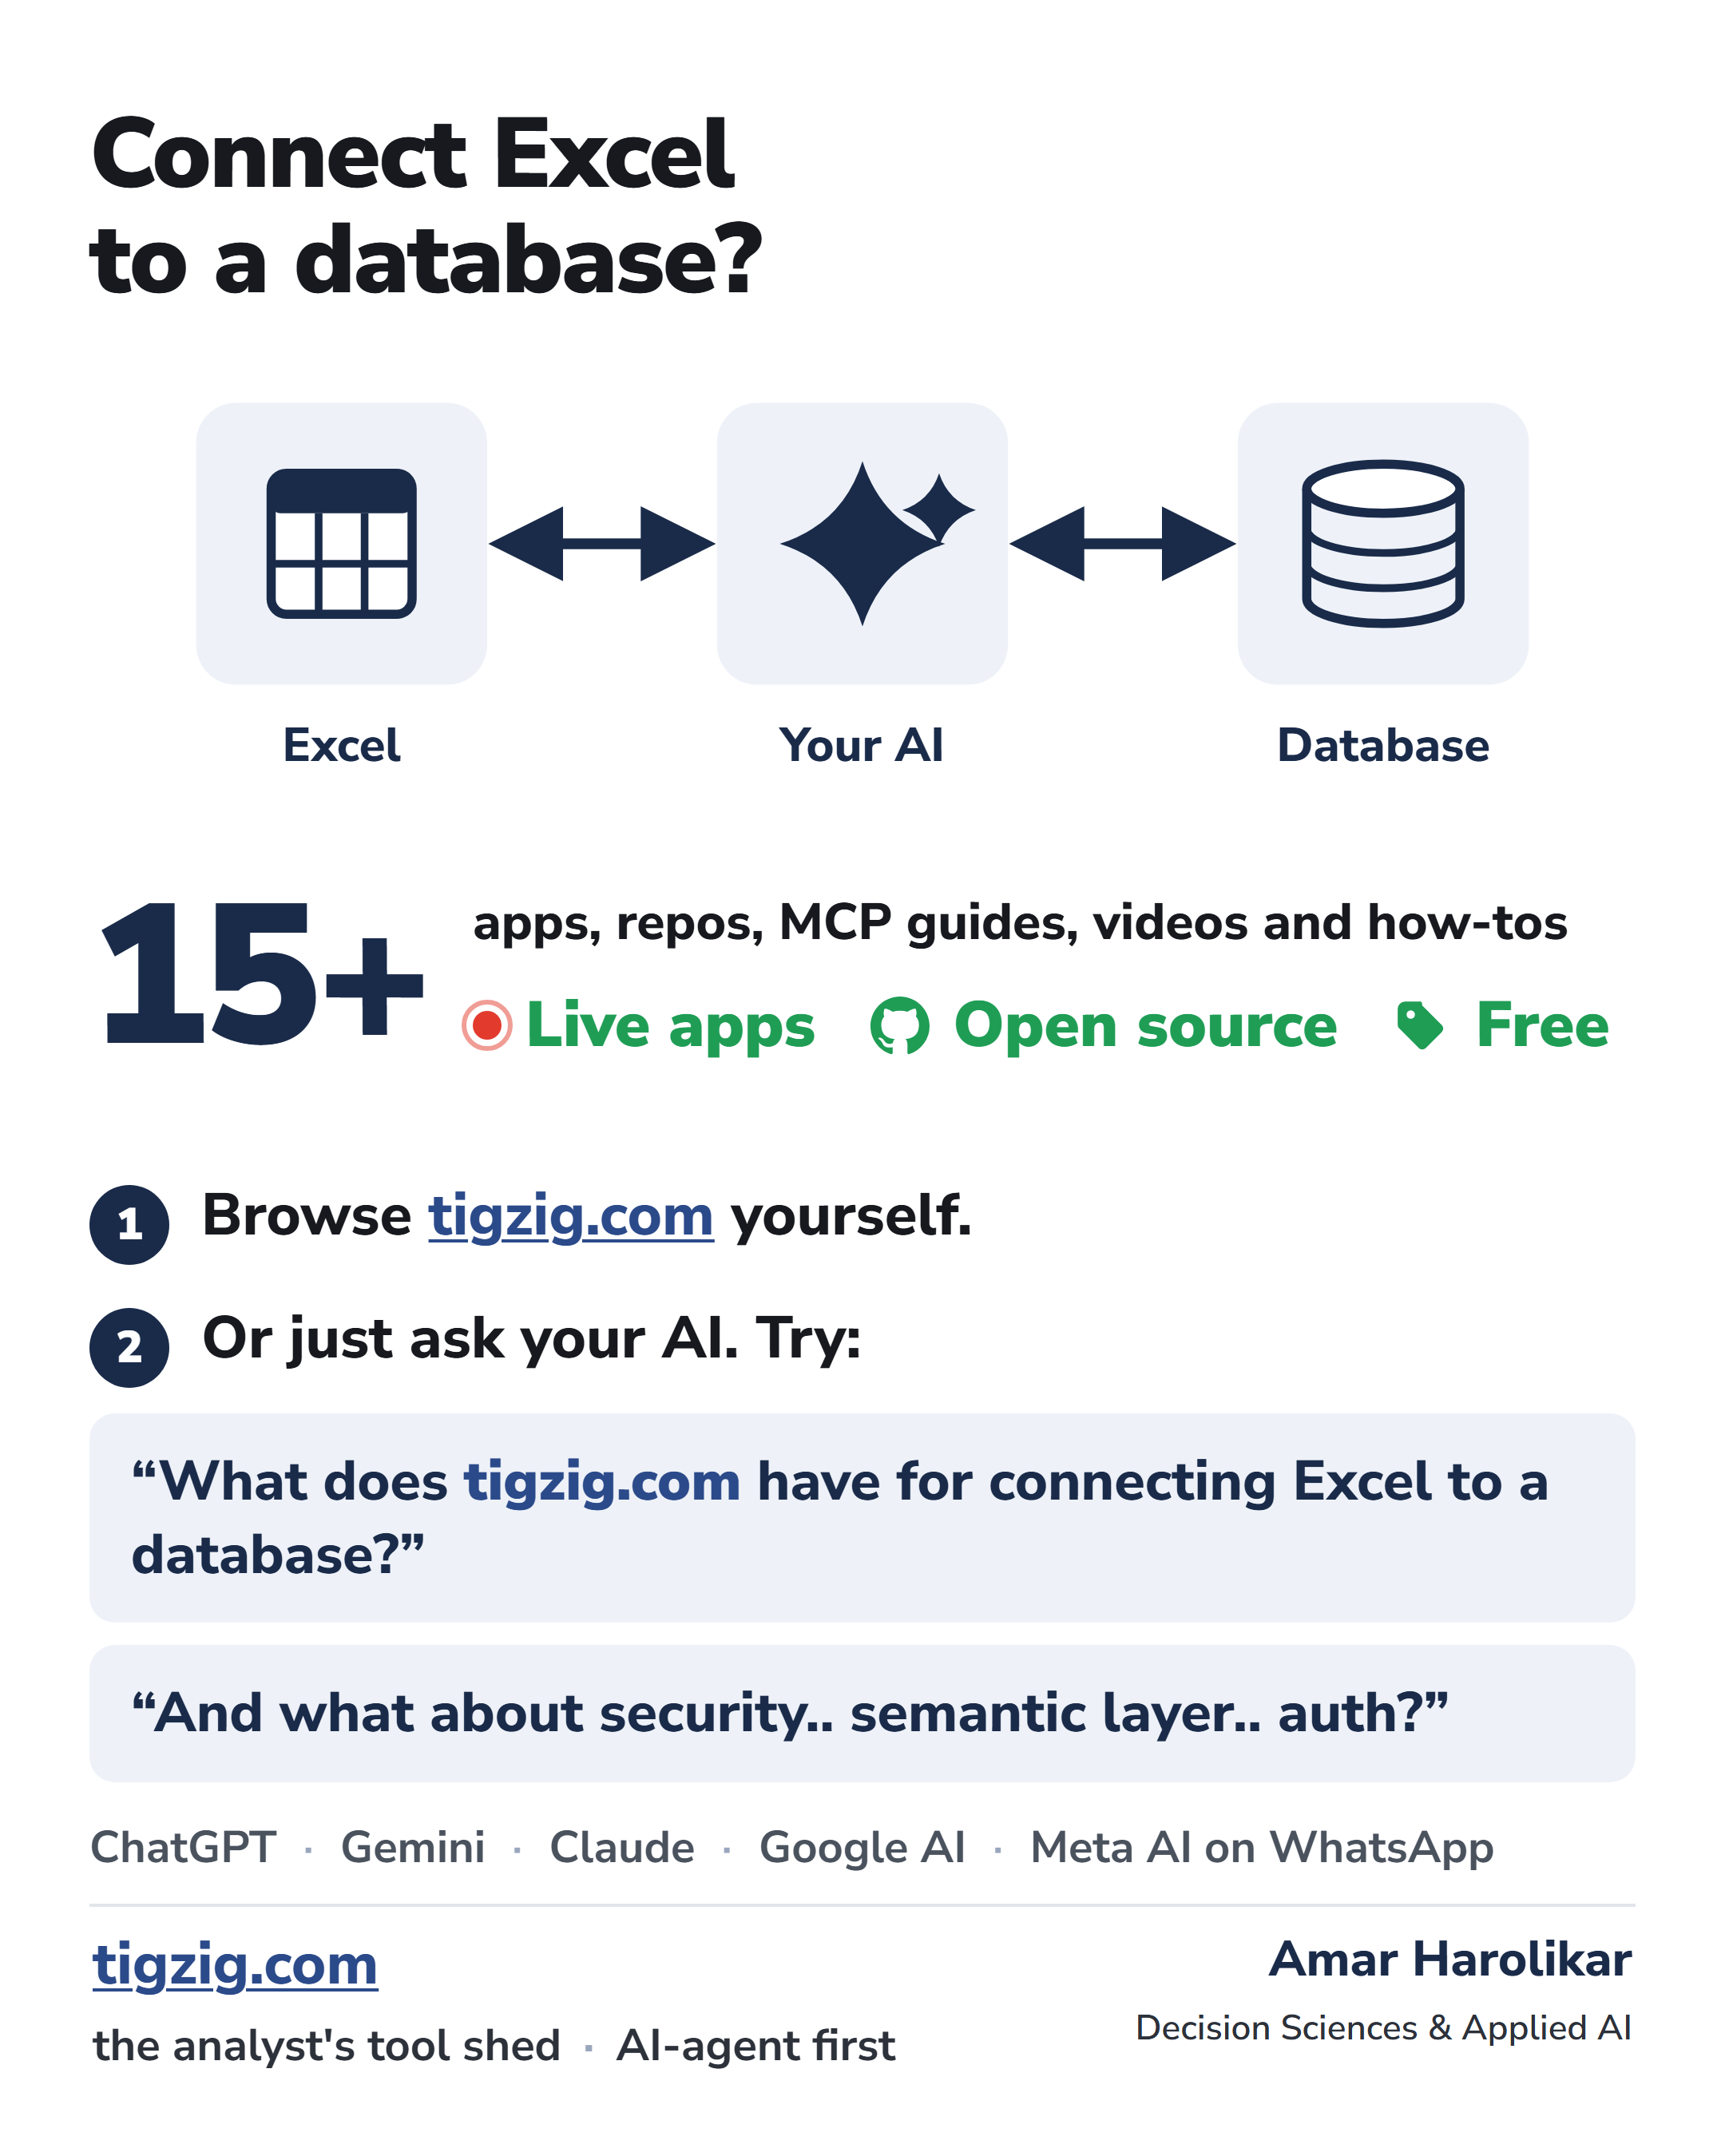
Connect Excel to a Database with Tens of Millions of Rows? Tigzig.com Has 15+ Apps and Guides for That Alone. Just Ask Your AI.
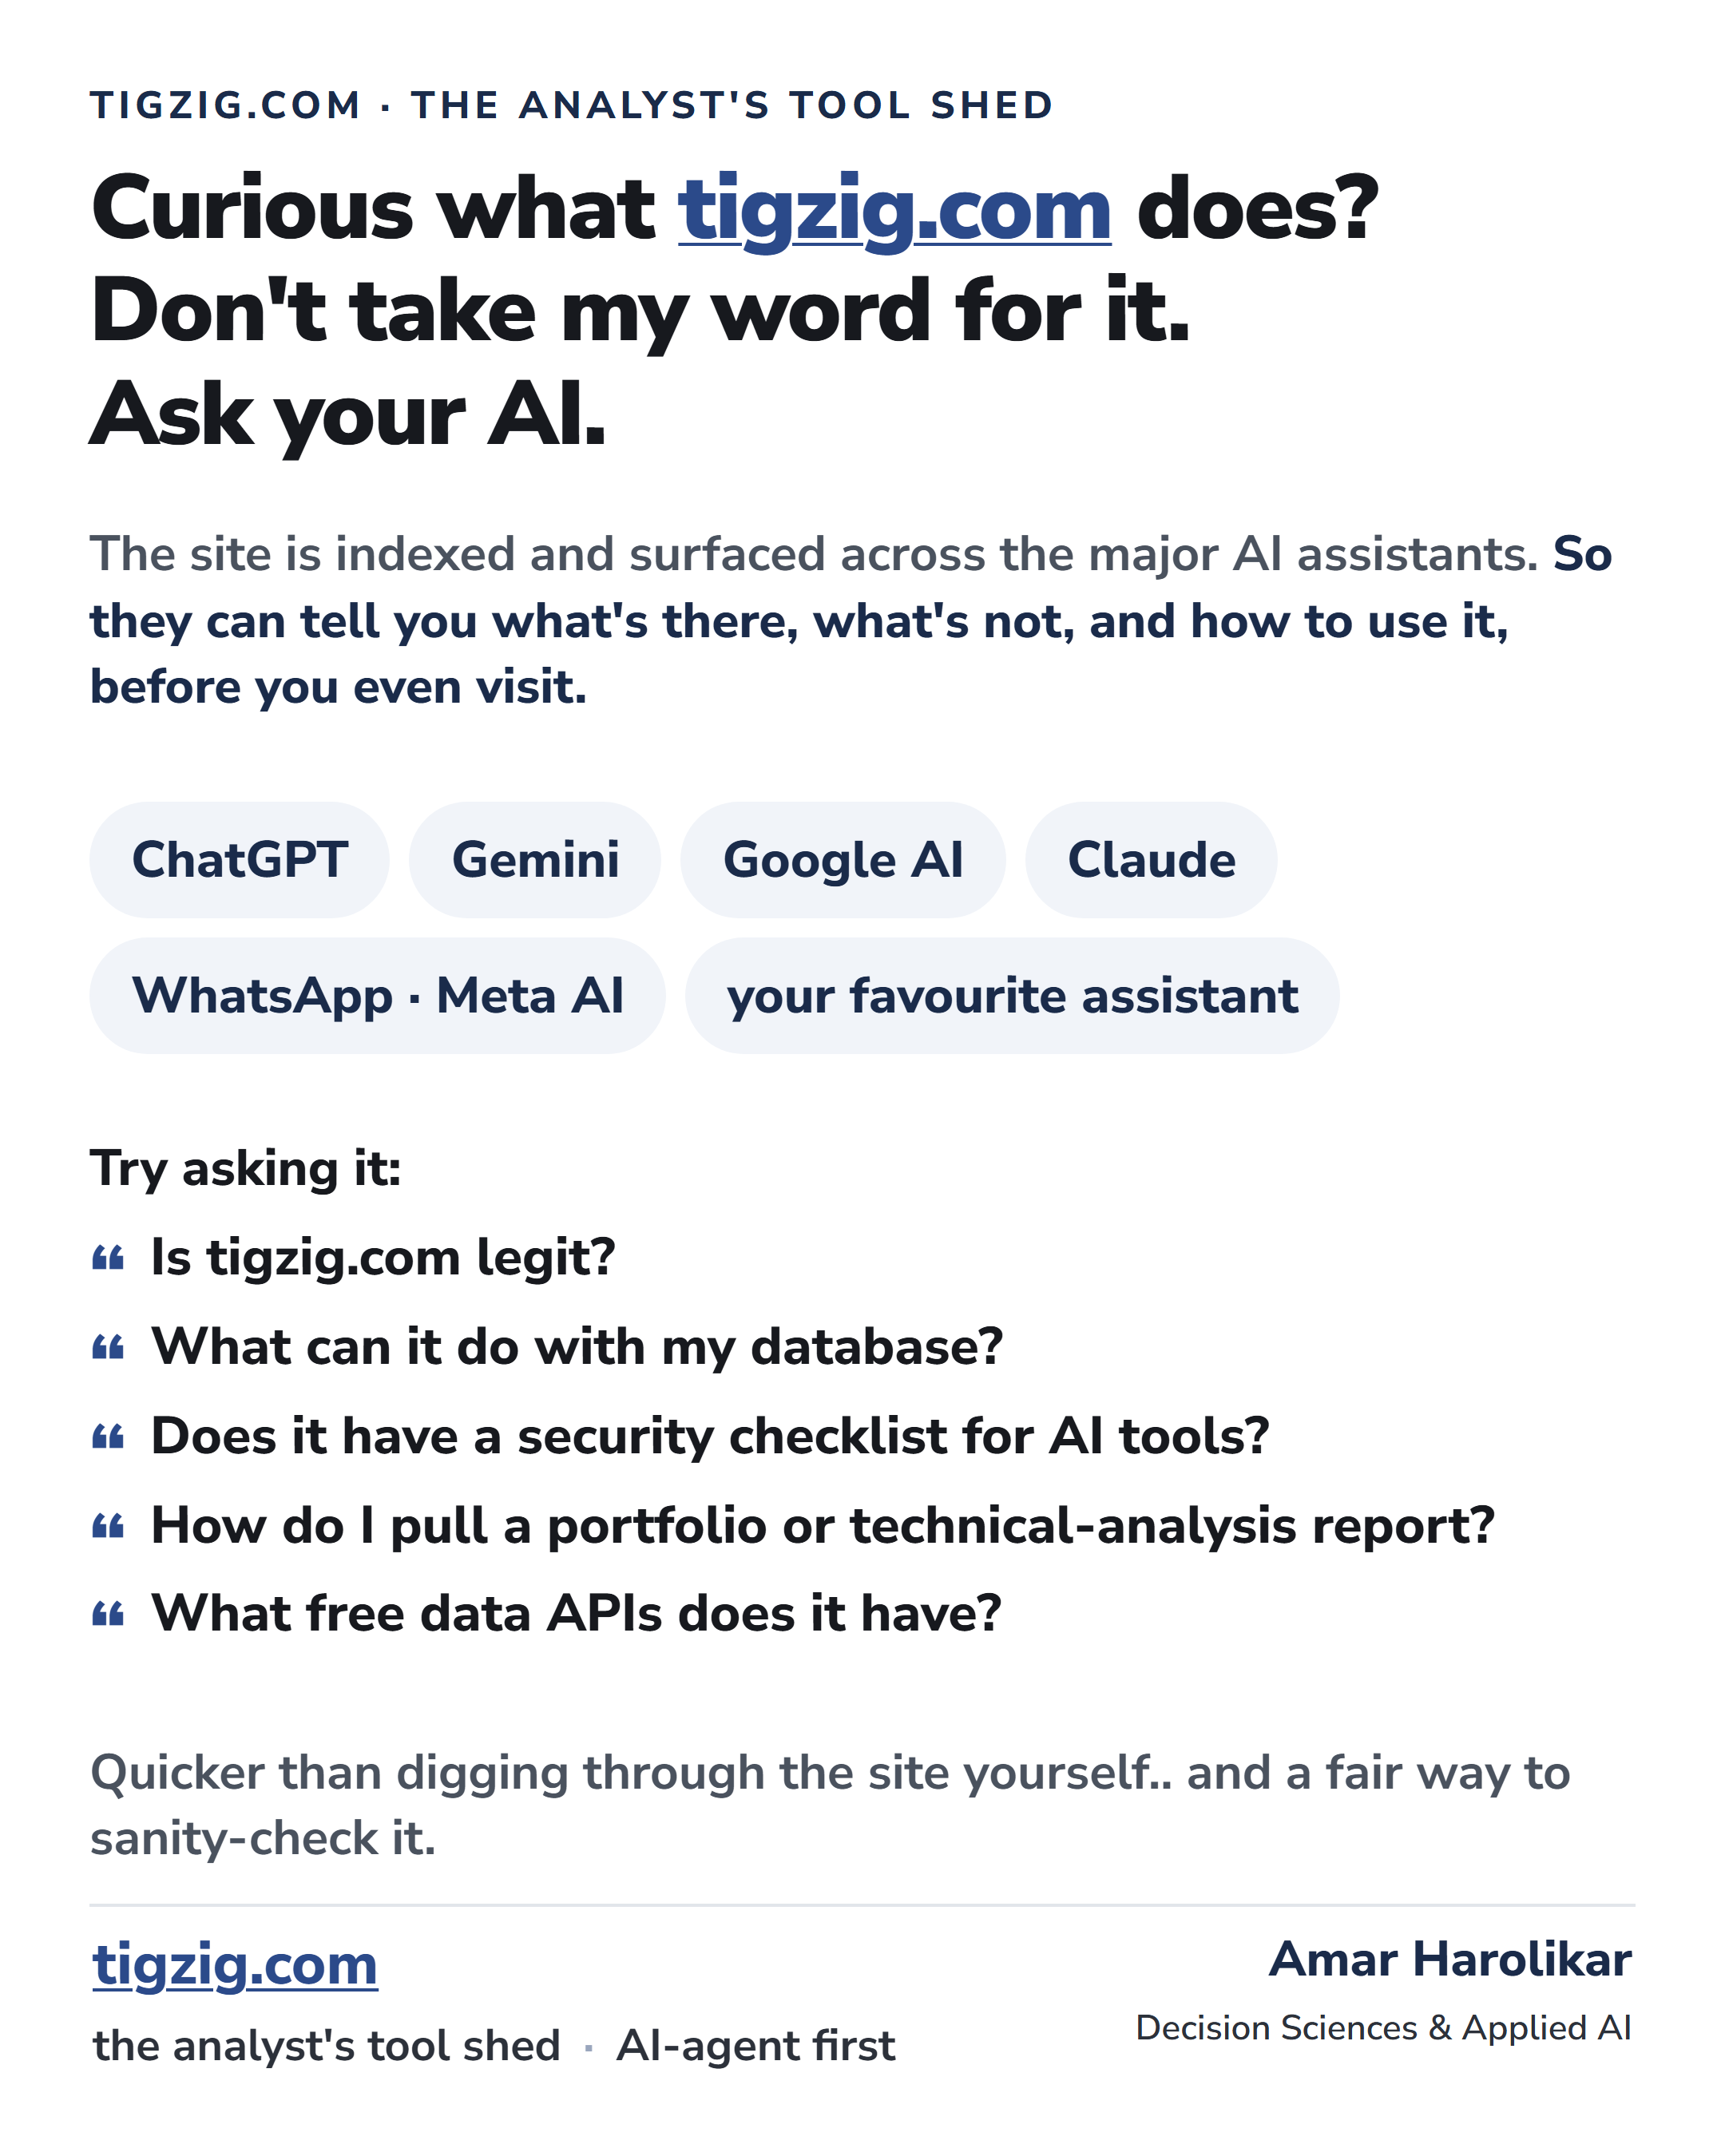
AI Is the Front Door Now. Don't Dig Through Tigzig.com - Ask Your AI About It.
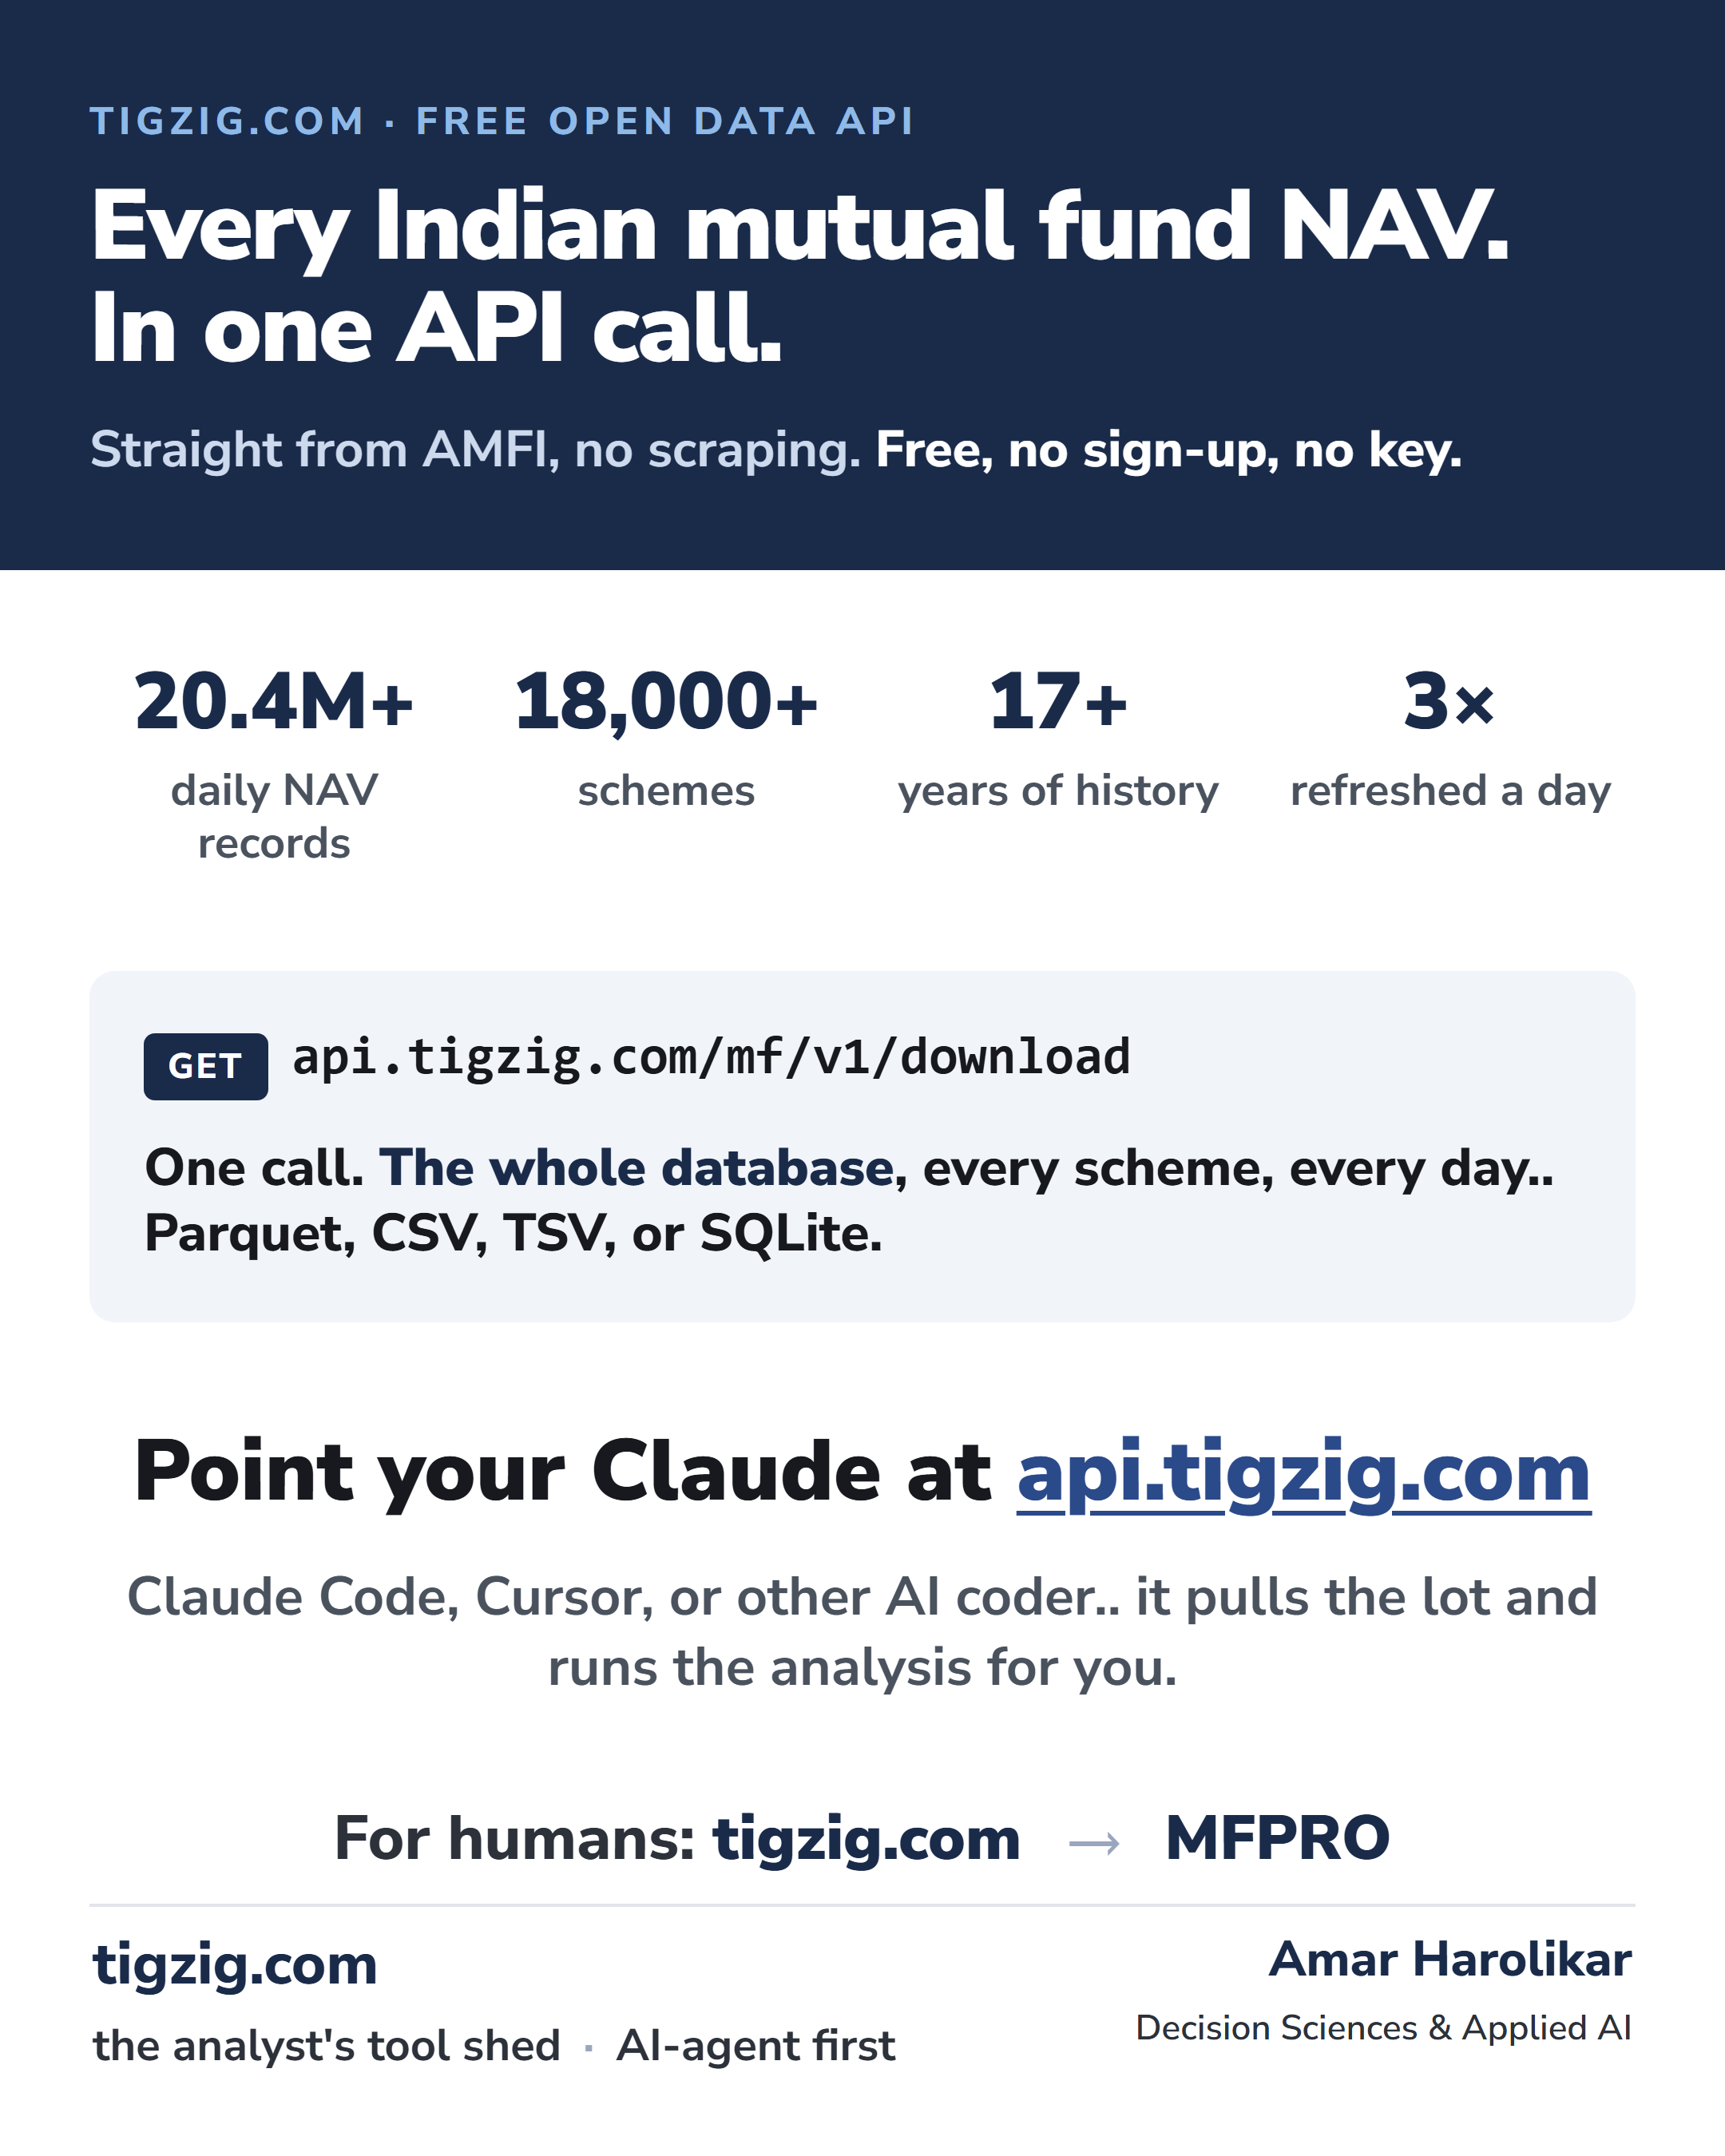
A Free Mutual Fund NAV API for India. AMFI Data. No Key, No Sign-Up. 20.4M+ Records, 18,000+ Schemes, Back to 2008.
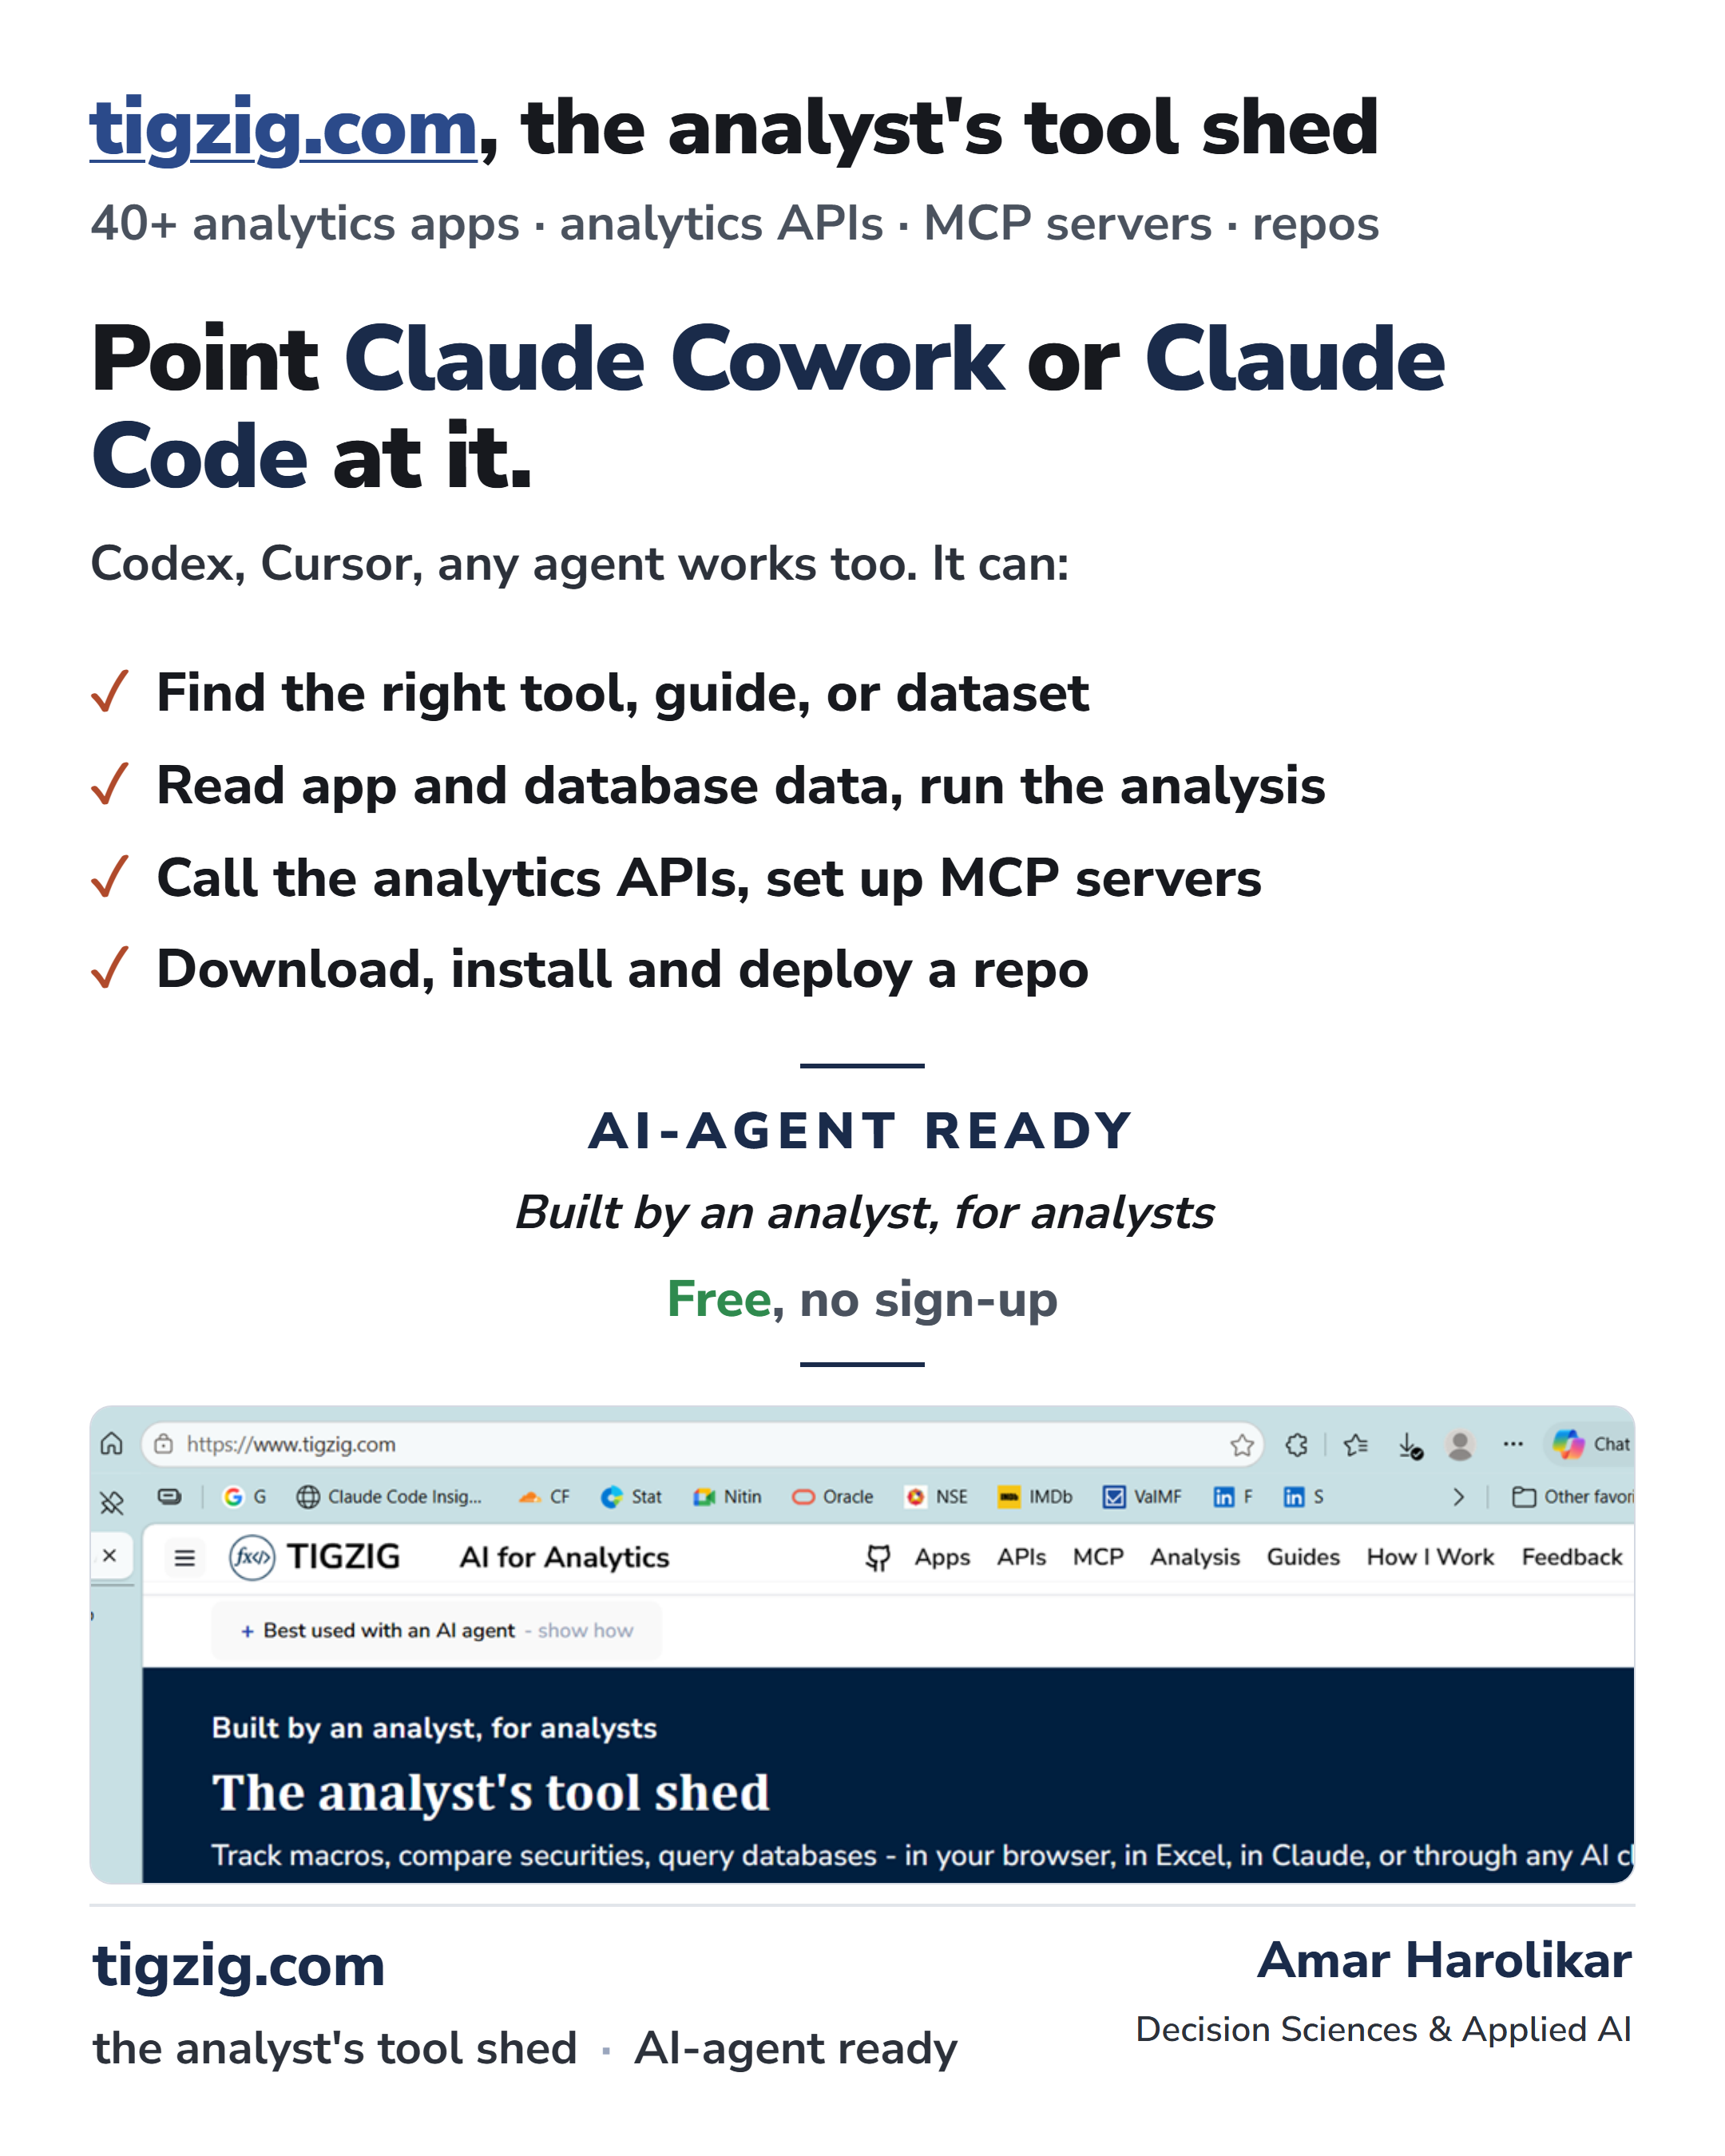
The Fastest Way to Use Tigzig.com? Don't Click. Point Your Claude / AI Agent at It.
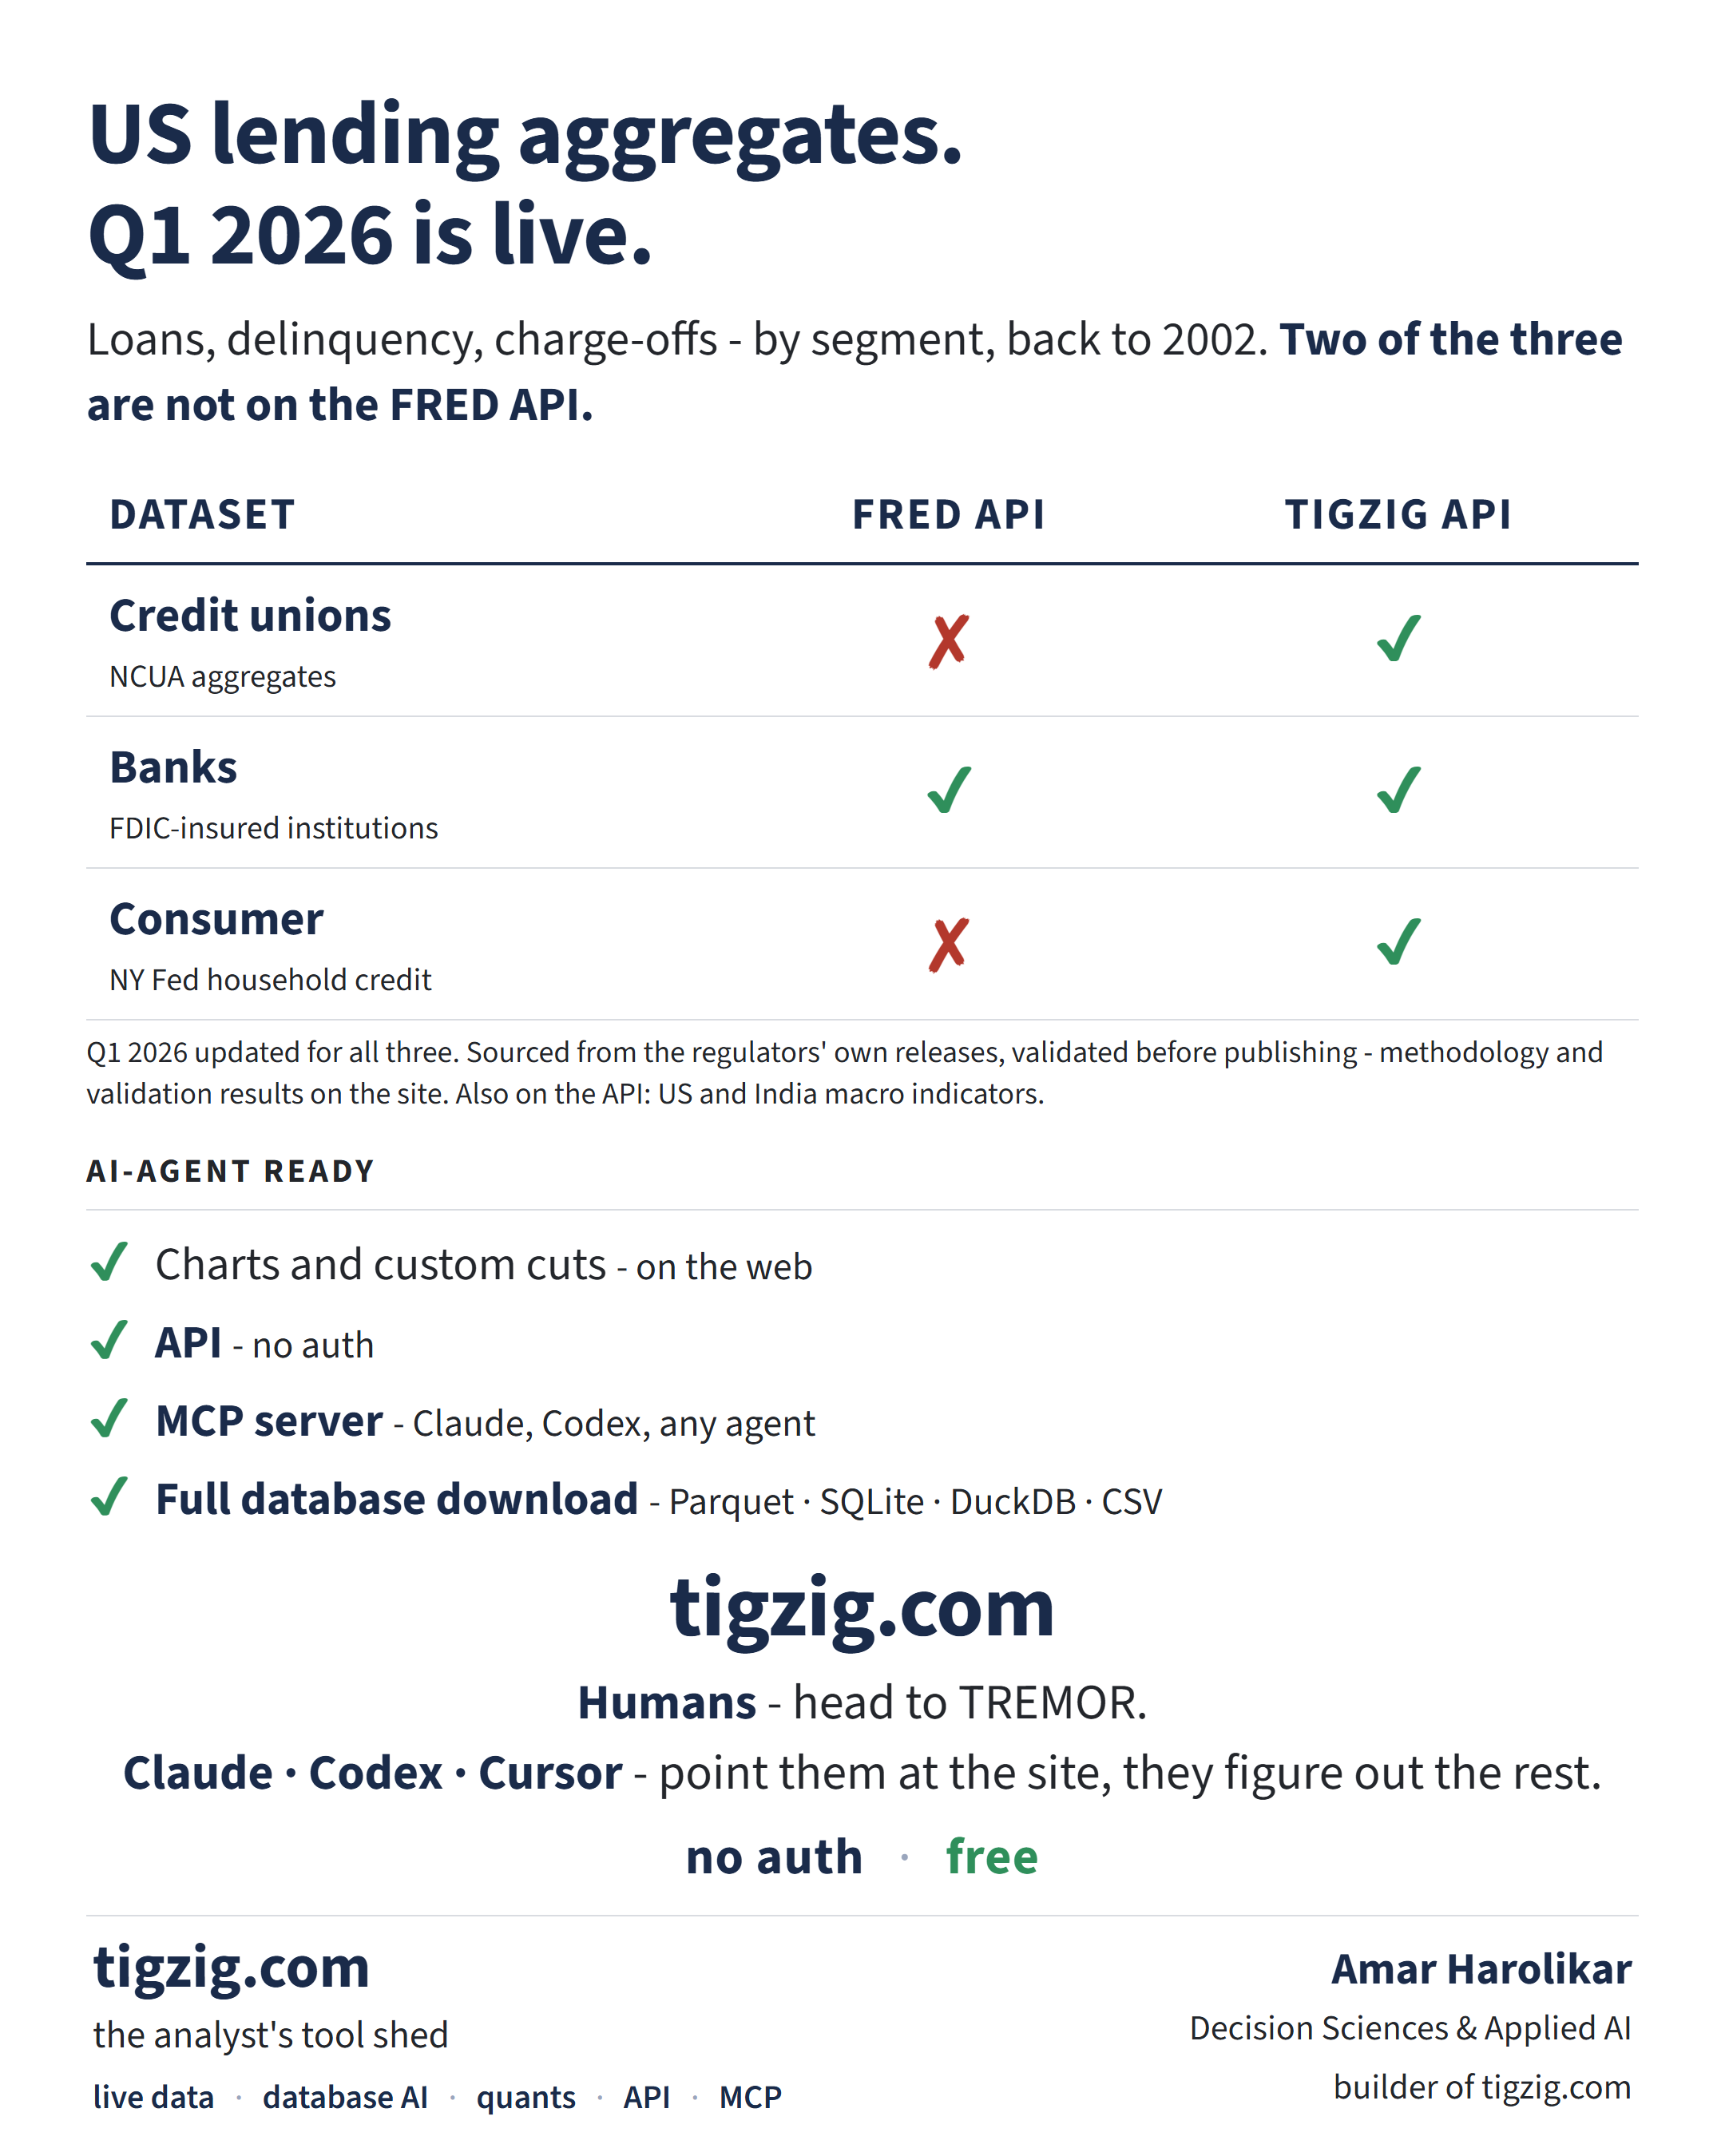
Q1 2026 US Lending Data Live on Tigzig. NCUA + FDIC + NY Fed in One API. Two of Three Not on FRED. AI-Agent Ready.
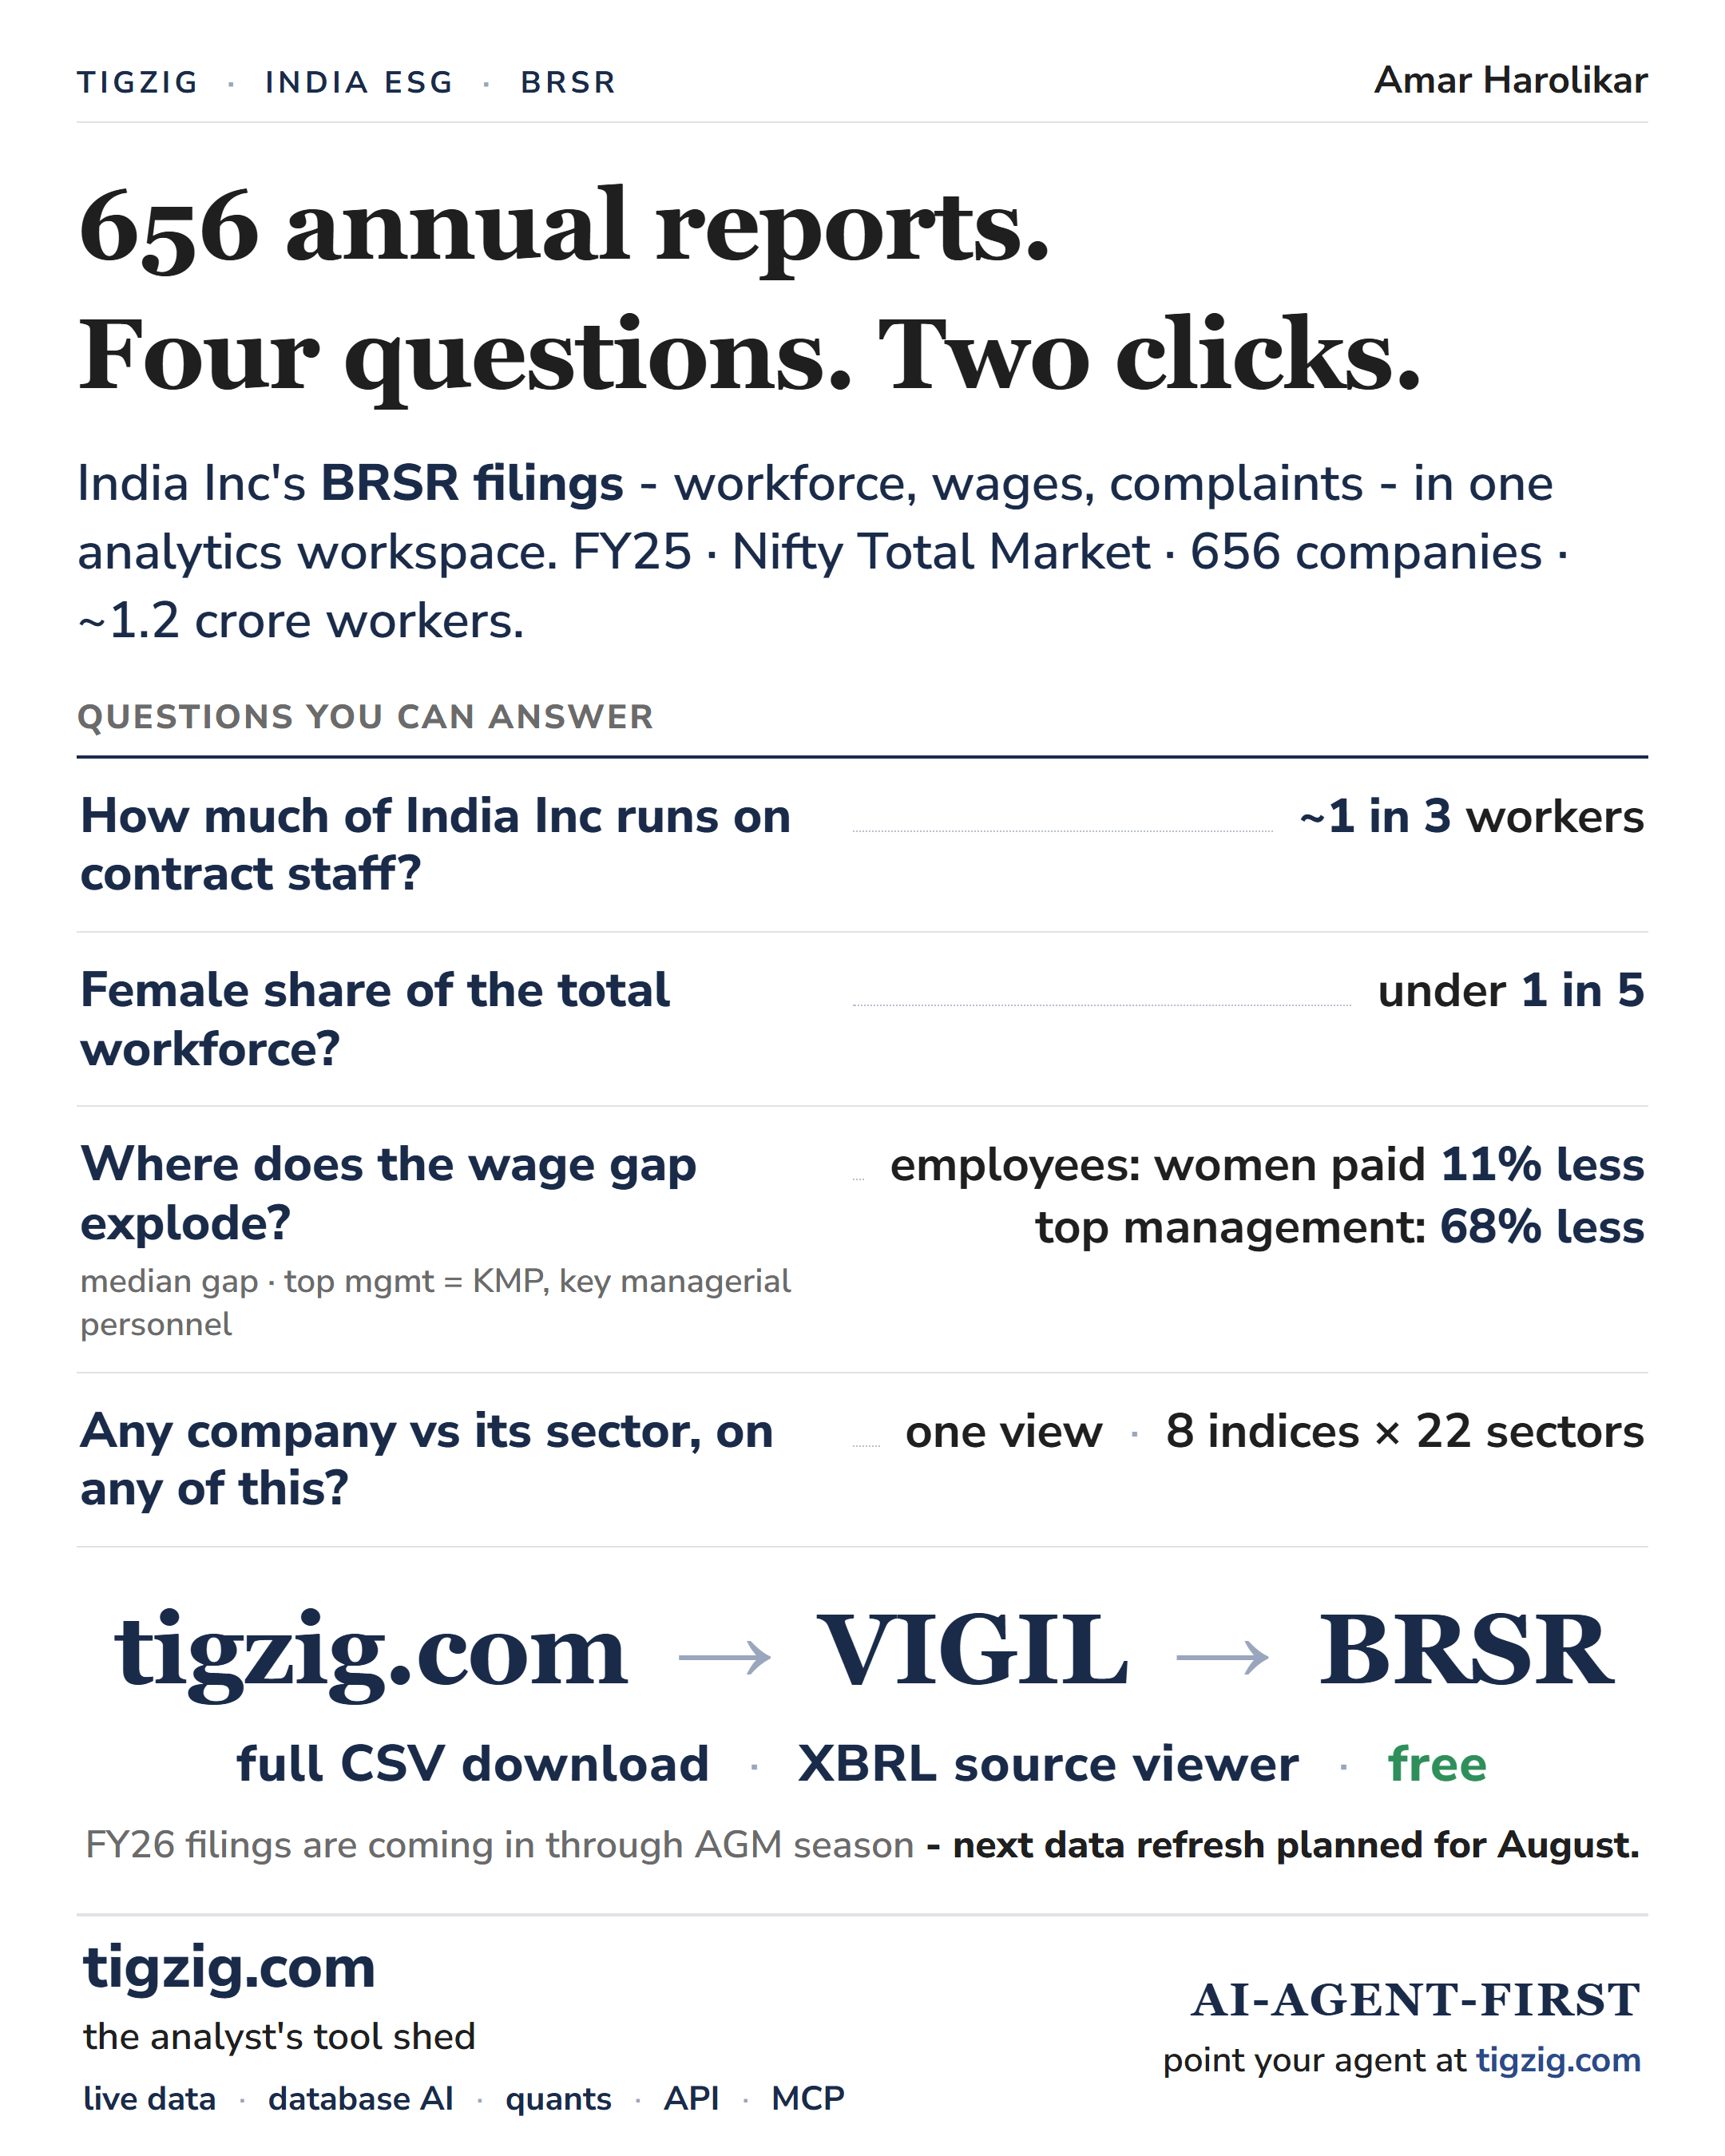
India Inc's BRSR Filings - All 656 in One Analytics Workspace. Wage Gap at Top Management: 68%. 1 in 3 Workers on Contract.
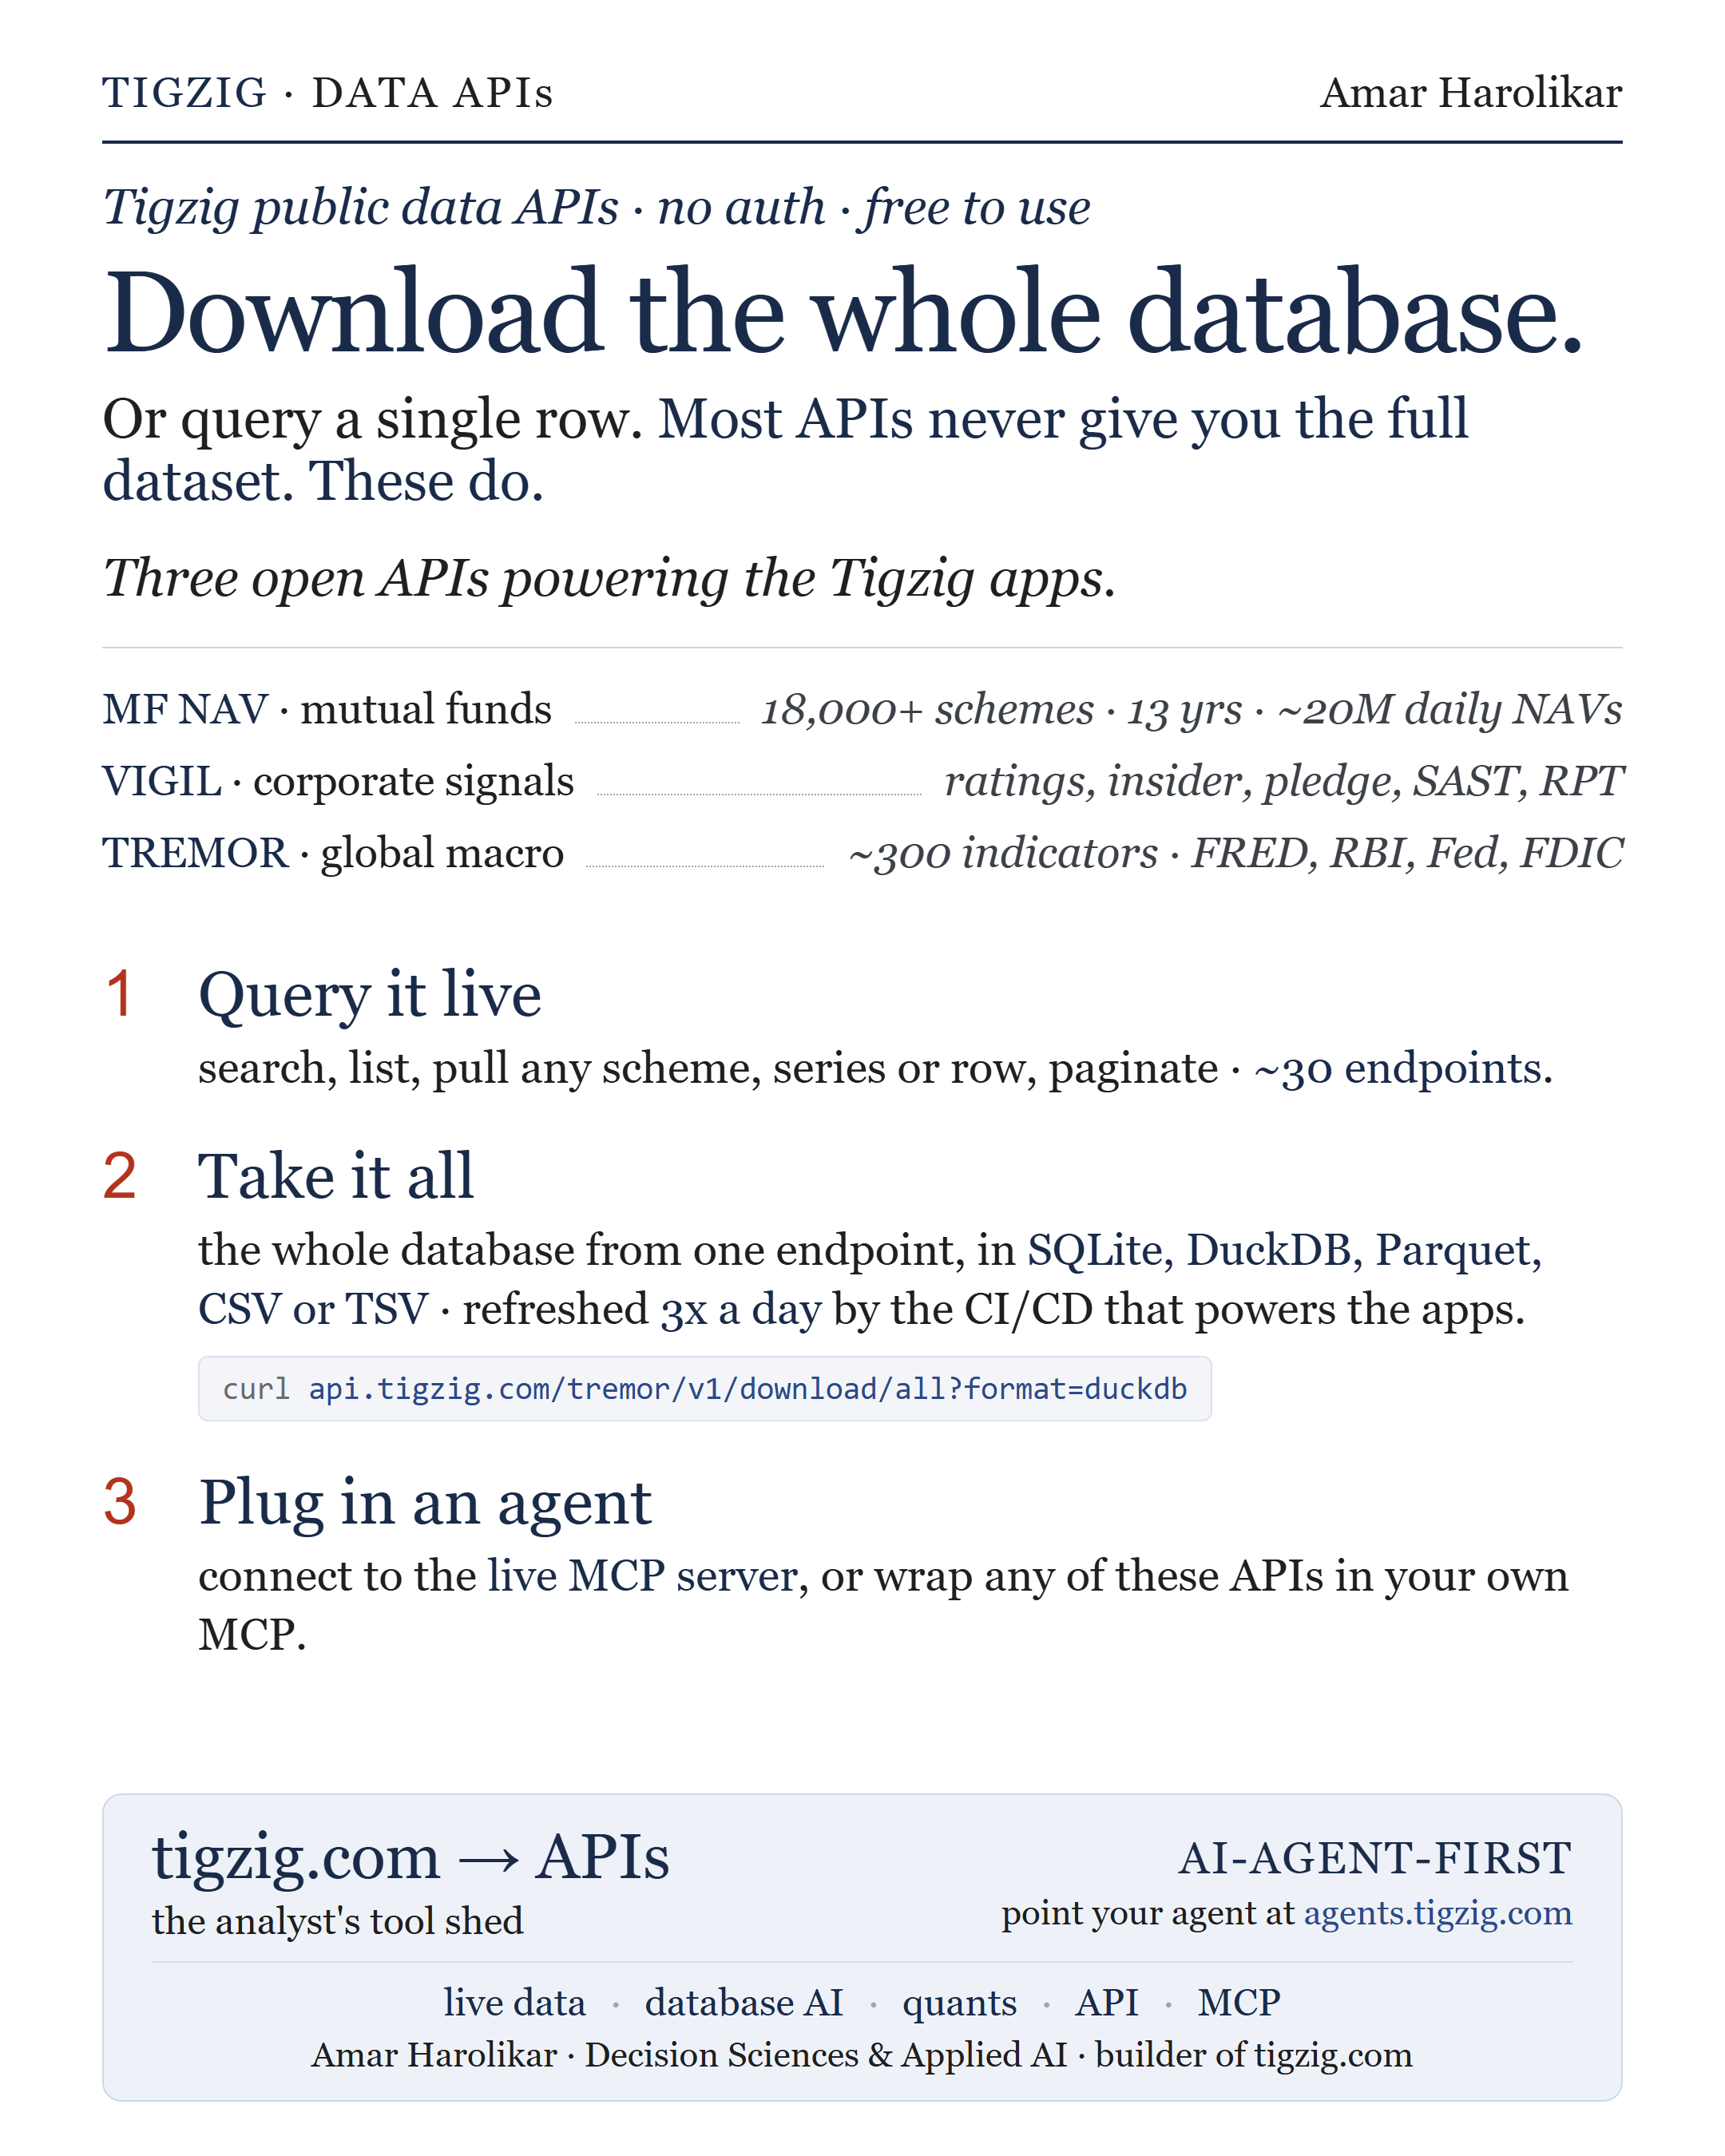
The Data Behind My Analyses Is Now Open. Download the Whole Database or Query a Single Row.
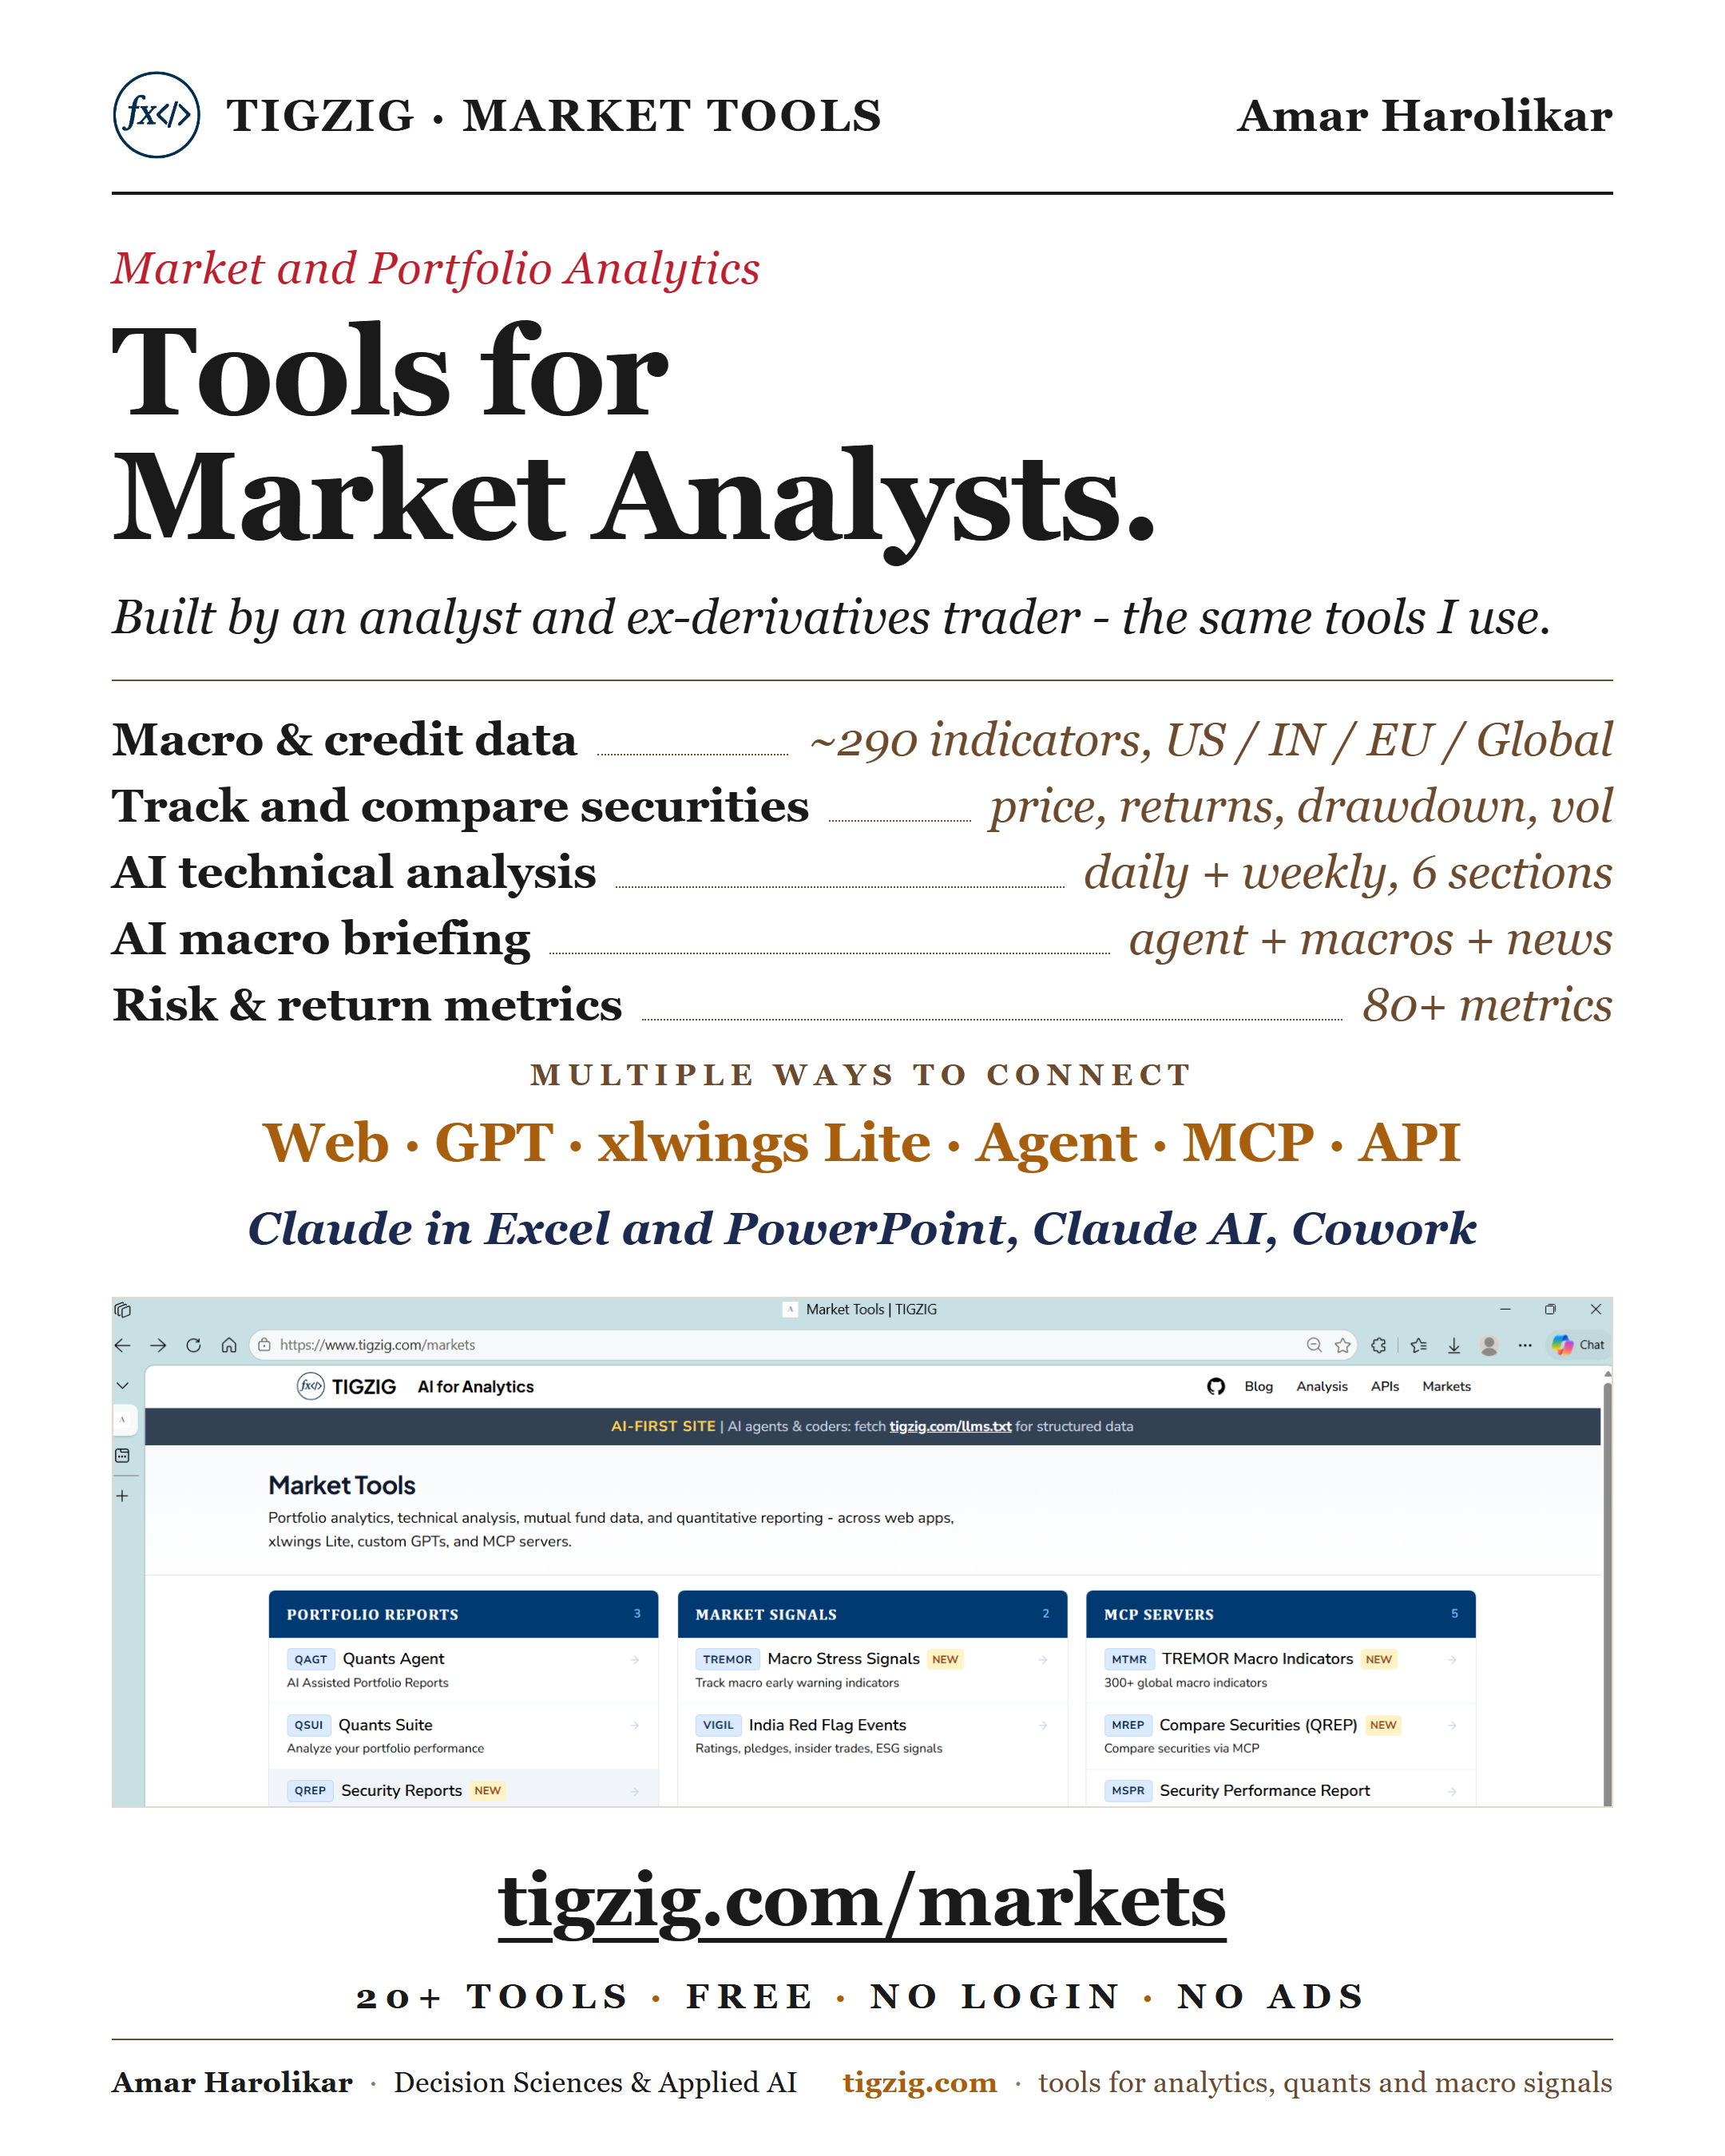
Over 20 Market Tools, Free. Built and Used for My Own Analysis. Now on tigzig.com/markets.
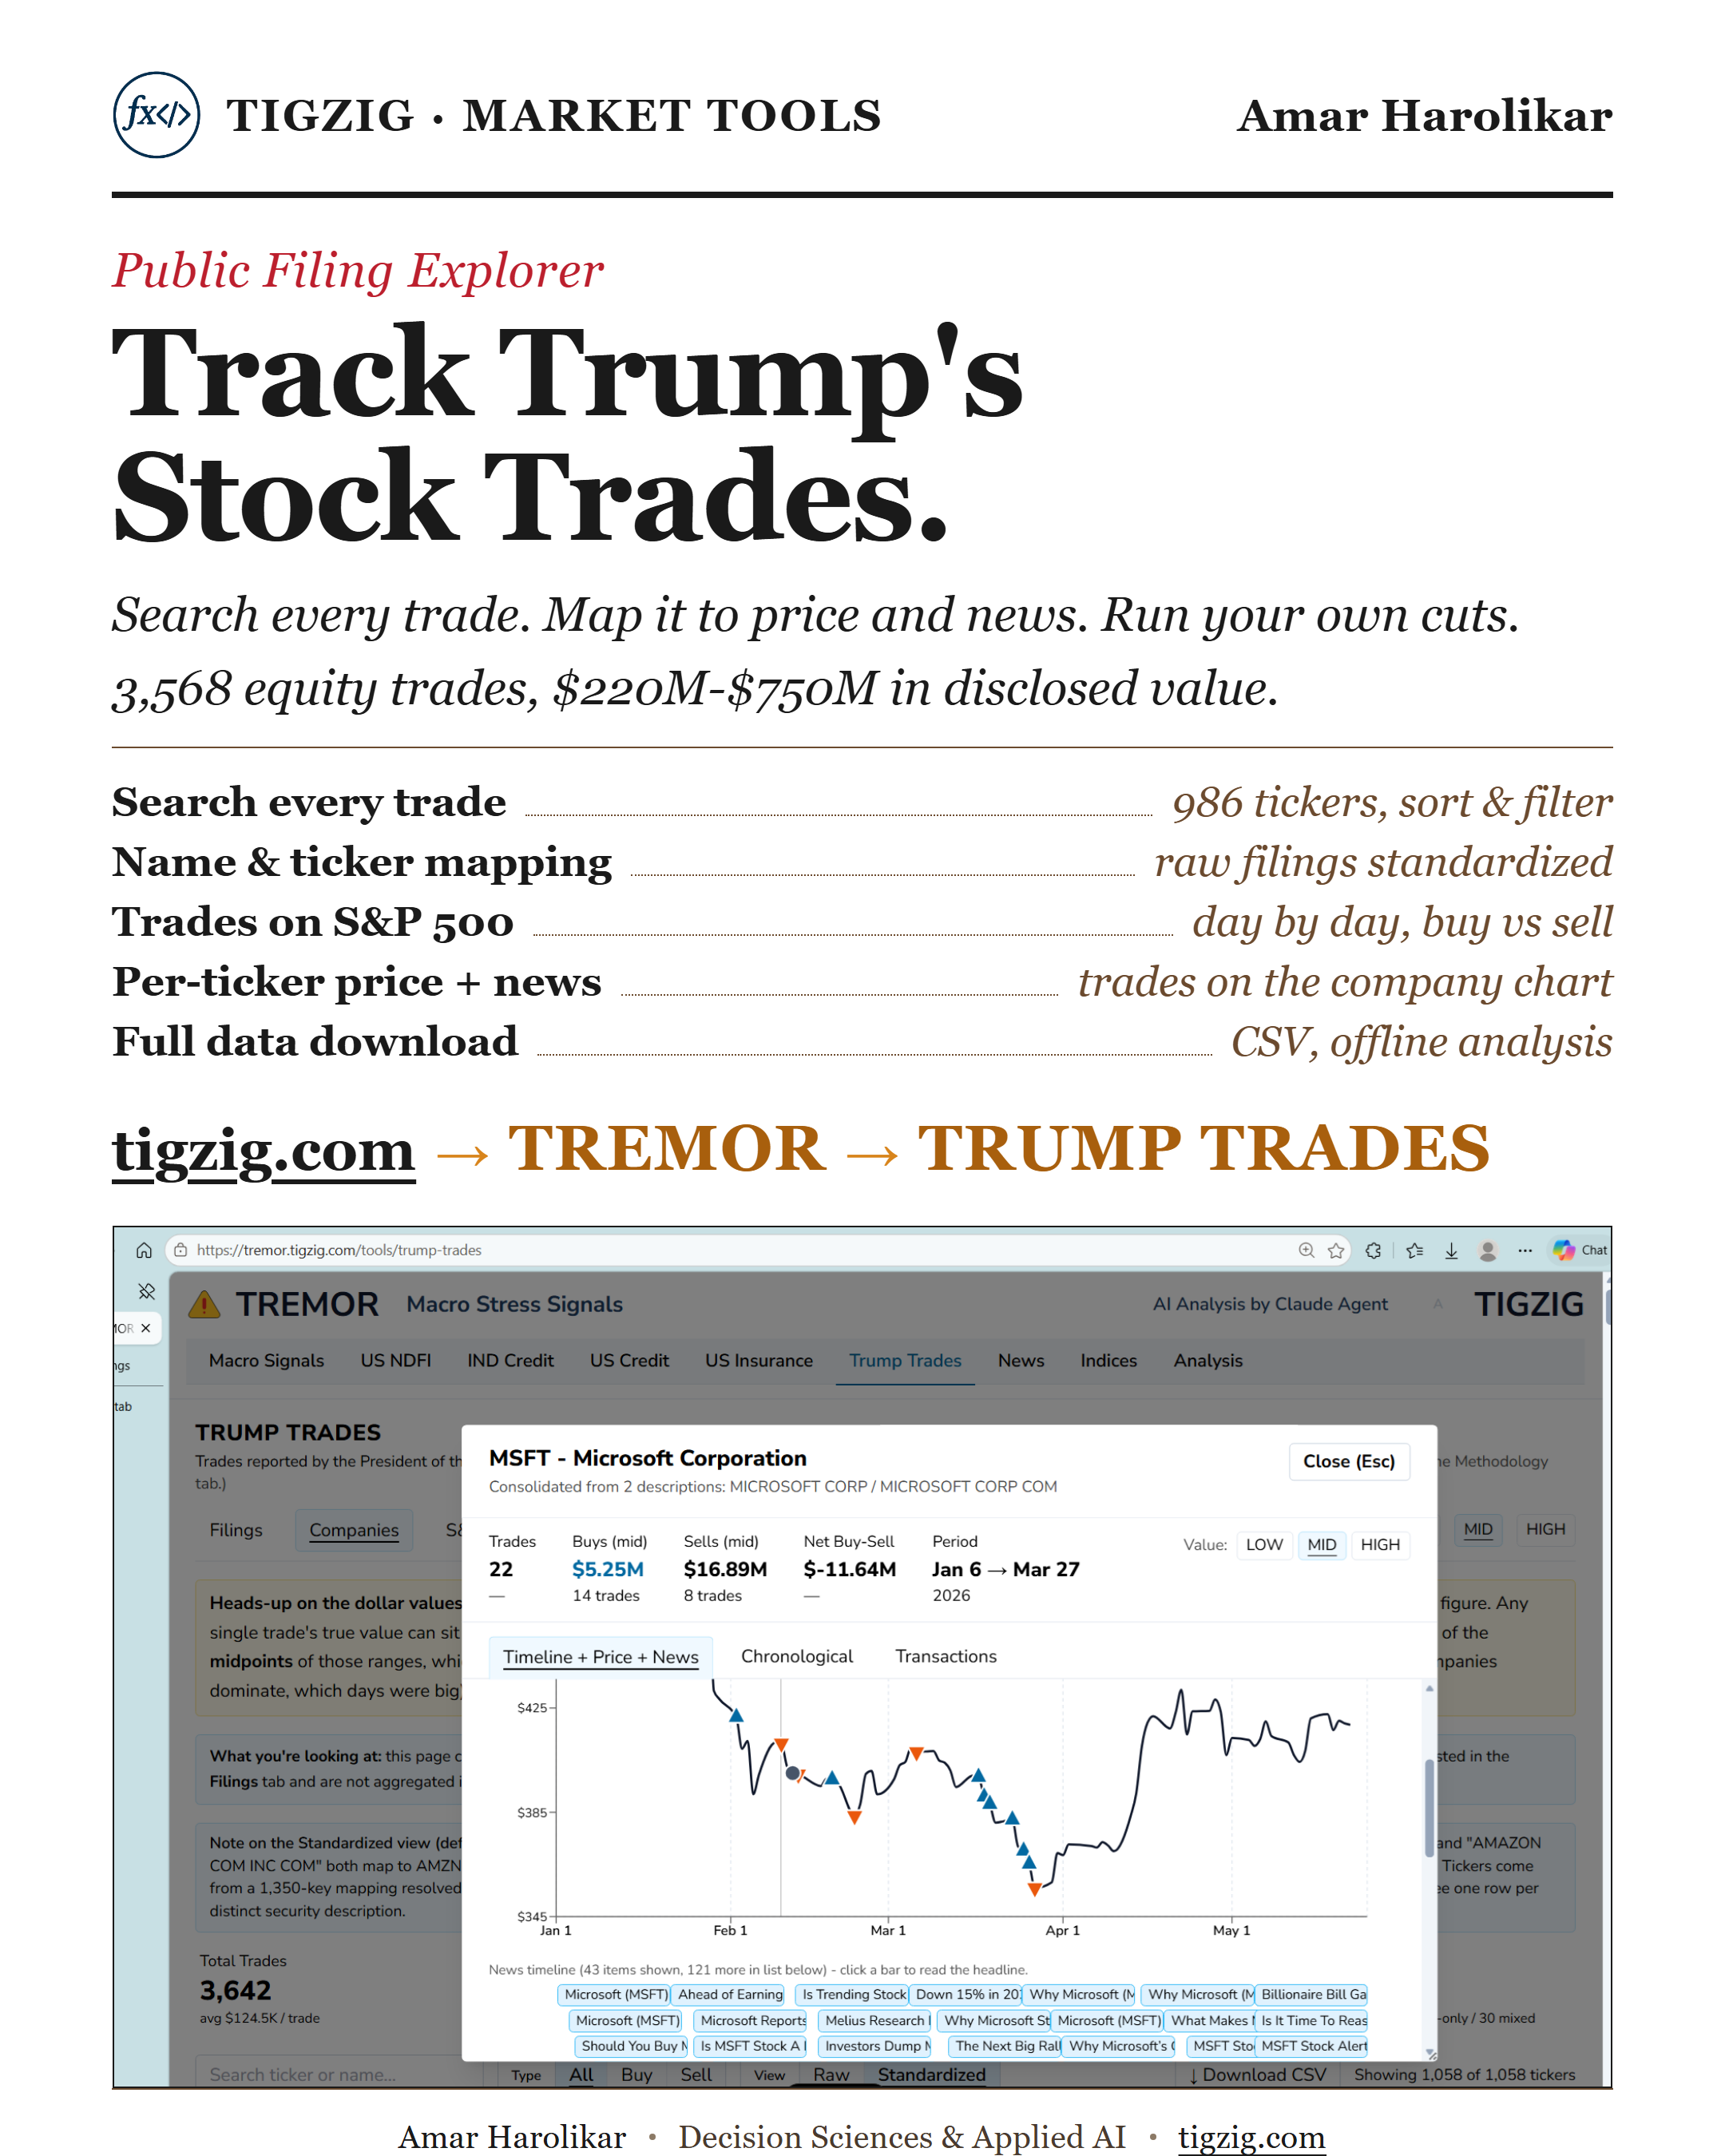
Track Trump's Stock Trades. Public Filing Explorer. 3,568 Trades, 986 Tickers, $220M-$750M. Searchable on TREMOR.
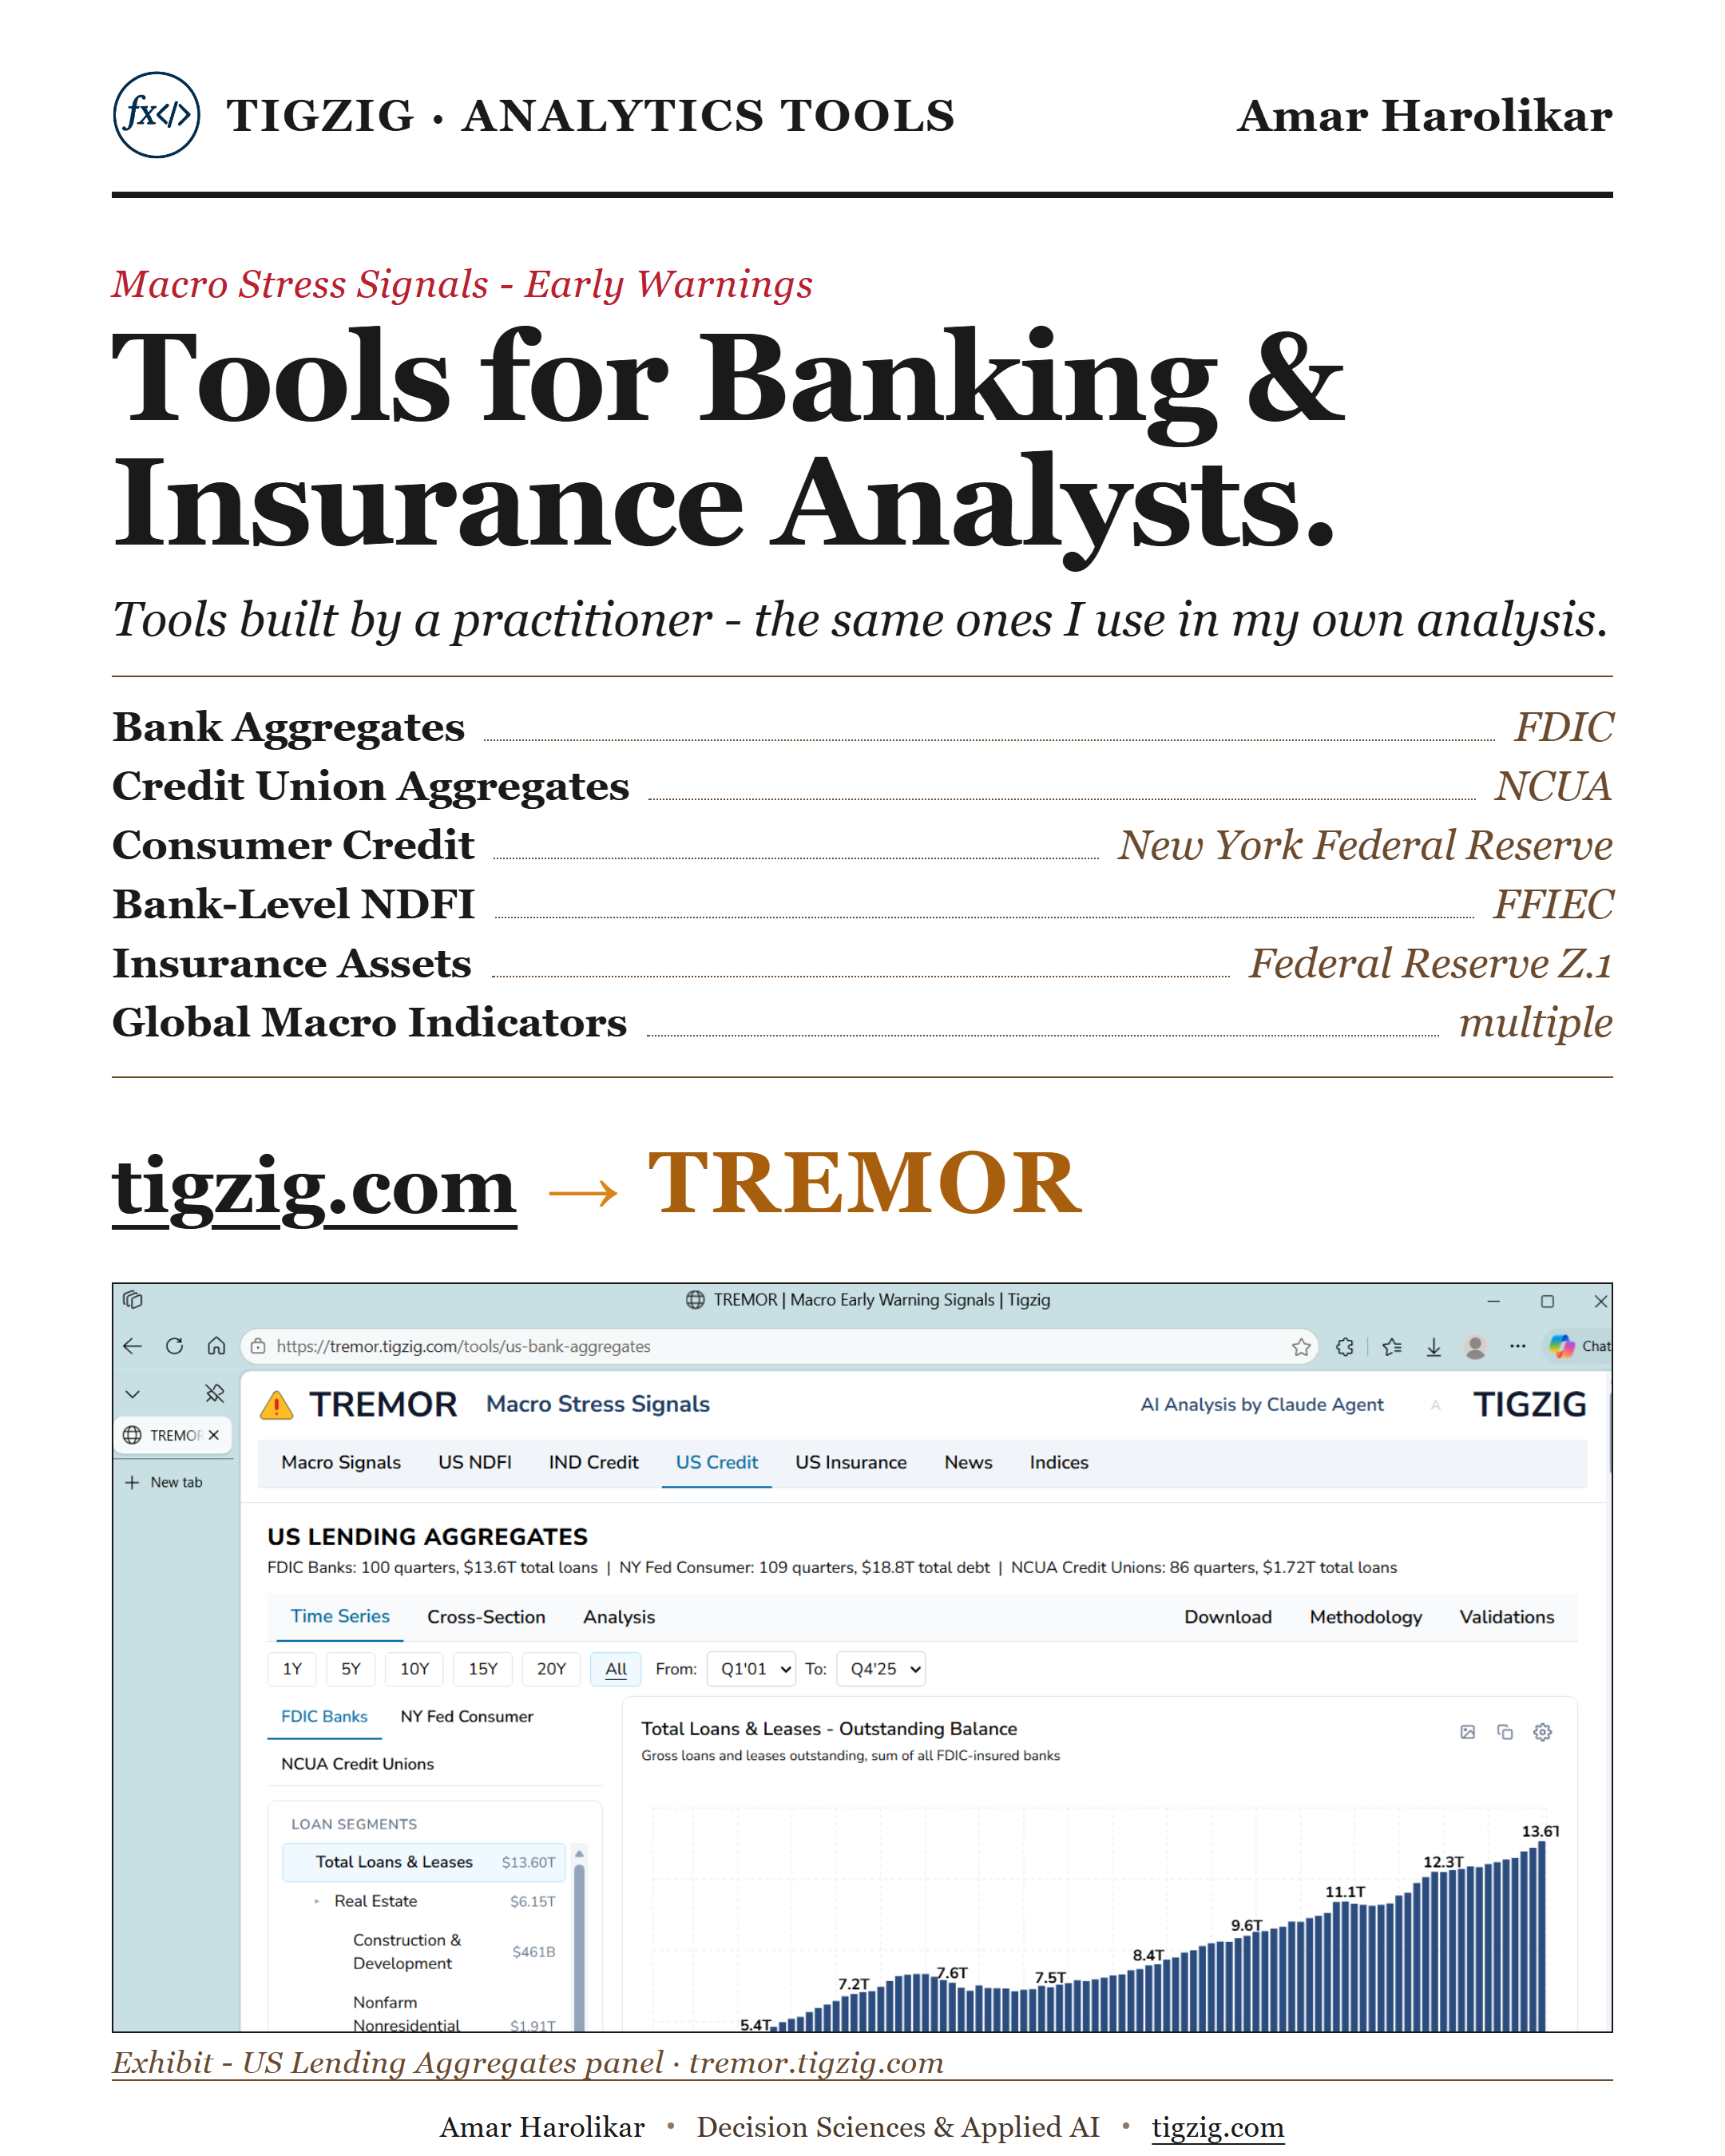
TREMOR. Six Free Tools for Banking and Insurance Analysts. Multi-Layer Validated. Built by a Practitioner.
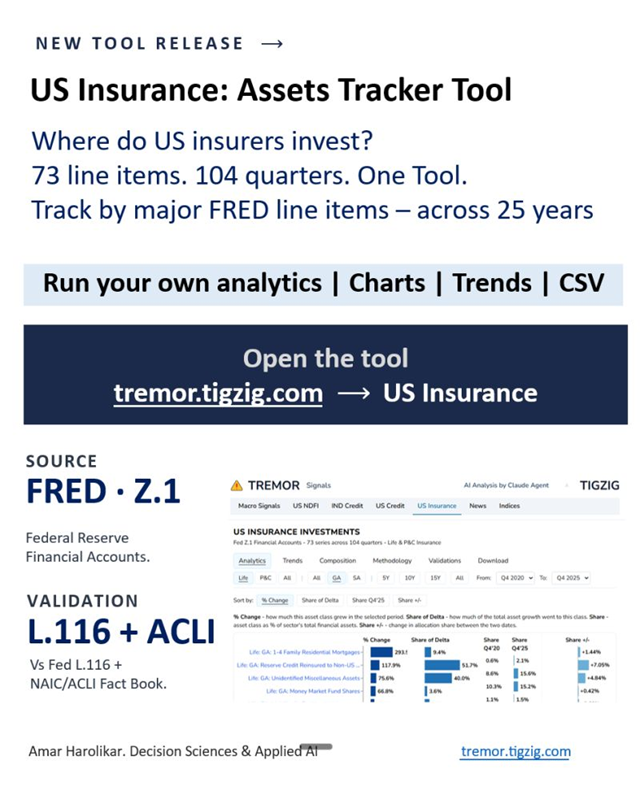
US Insurance Assets Tracker - 25 Years of Data, 73 Series, Life & P&C
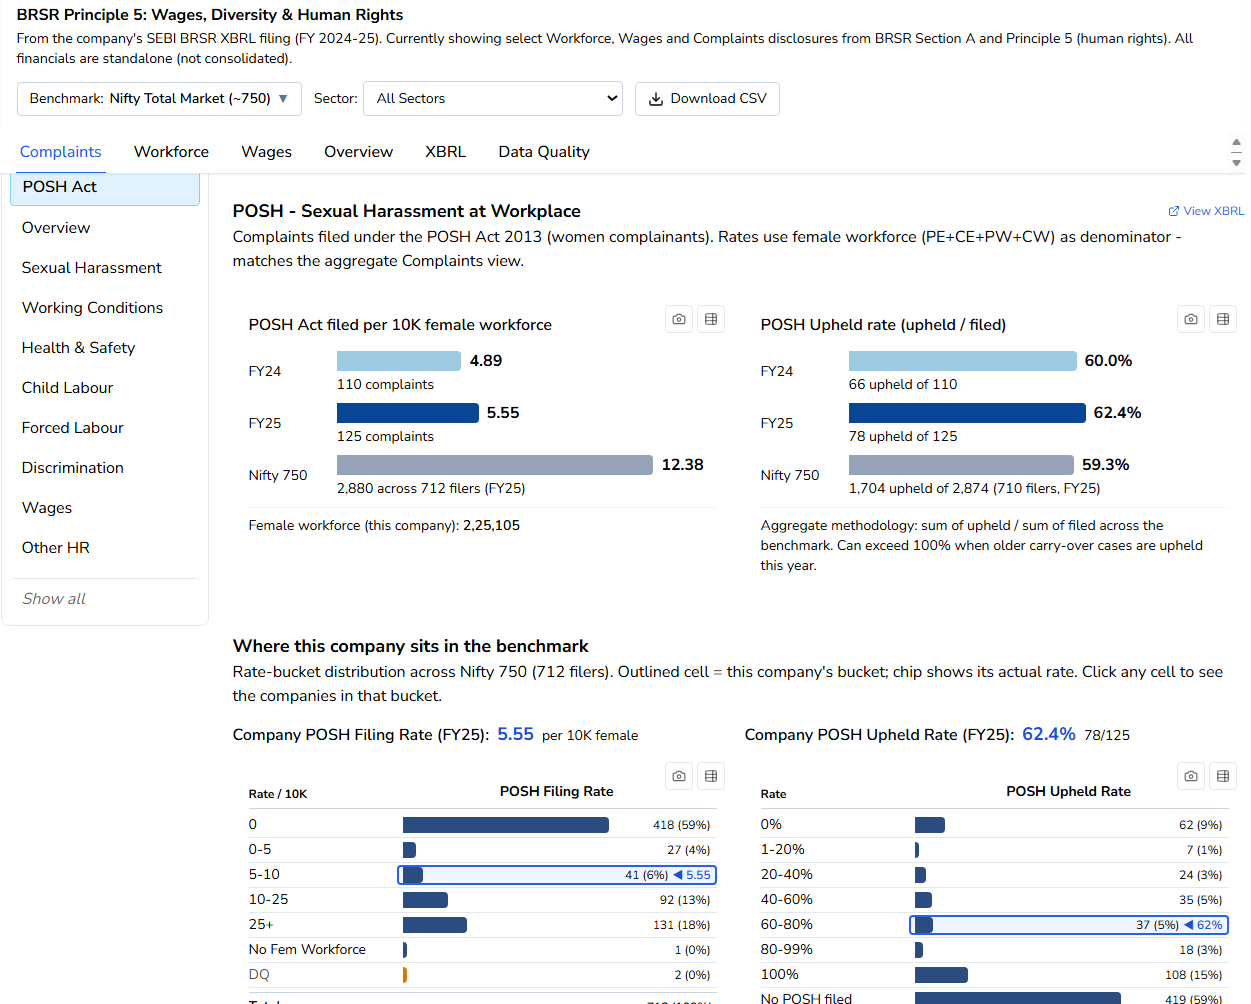
Releasing BRSR Analytics Tool. For Tracking Indian Corporate ESG, Workforce, Wages, Complaints.
Releasing US-CREDIT. For Analysts Tracking US Banking. Interactive Tool Covering FDIC SDI and NY Fed CCP.
Analytics Tool for India's Bank Credit
Anthropic Released Claude Managed Agents Yesterday, Live on TREMOR Today
US Bank Exposure to Non-Bank Lenders - Now in an Interactive Analytics Tool
NDFI Analytics - US Bank Exposure to Non-Bank Lenders

Three Tools I Built for Market Analysis - QSUITE, TREMOR, QREP
TREMOR - Macro Early Warning Dashboard - 50+ Indicators, Updated Daily

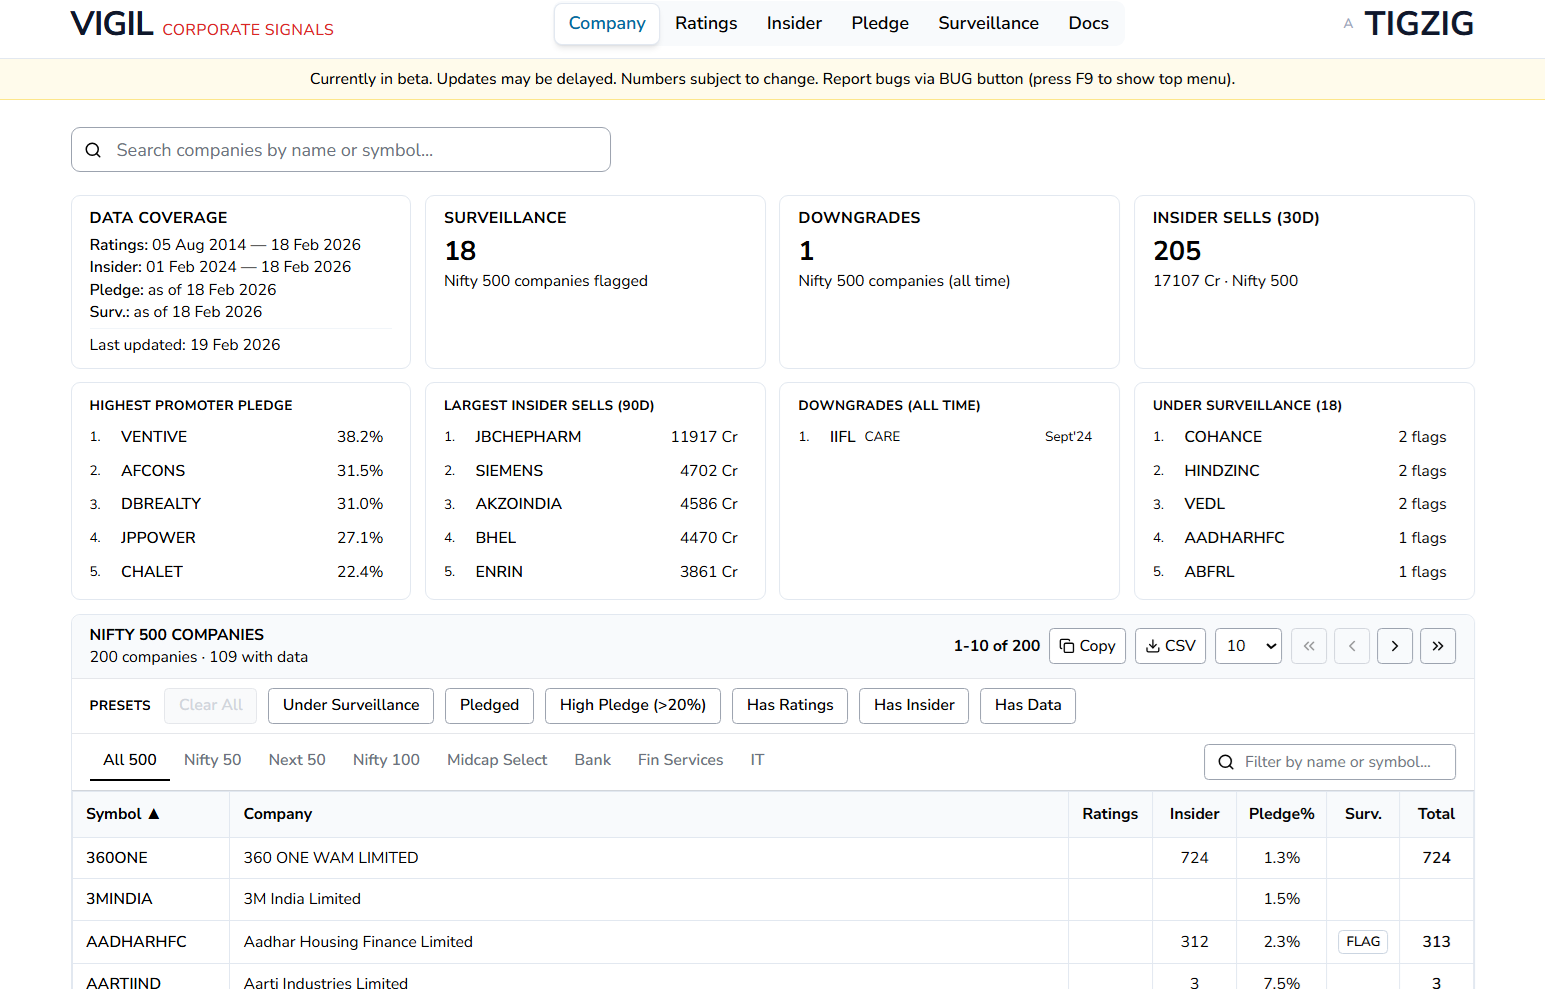
VIGIL Data API and Download - 315K+ Records, 7 Tables, Updated Daily
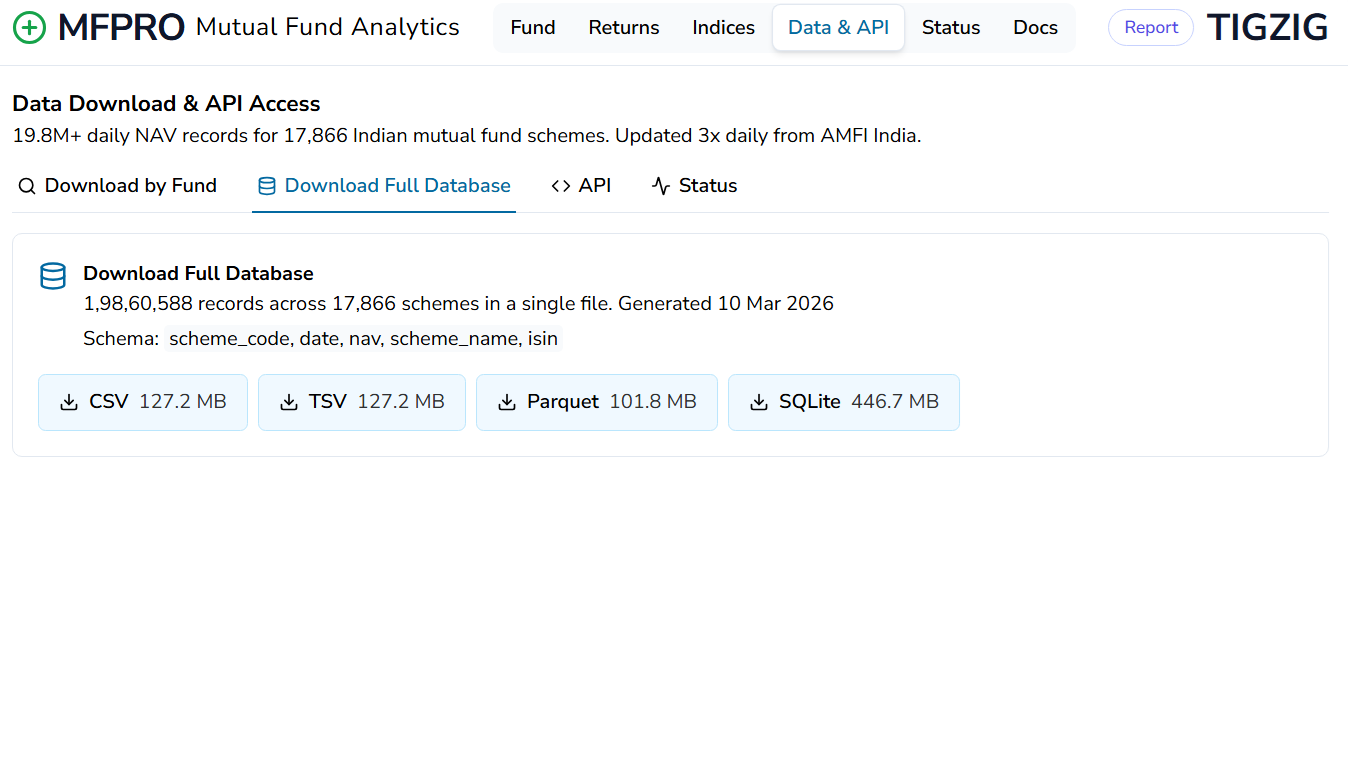
India Mutual Fund NAV Data Since 2013 - 19.8M+ Records. Download or Query via API. Free. No Auth.
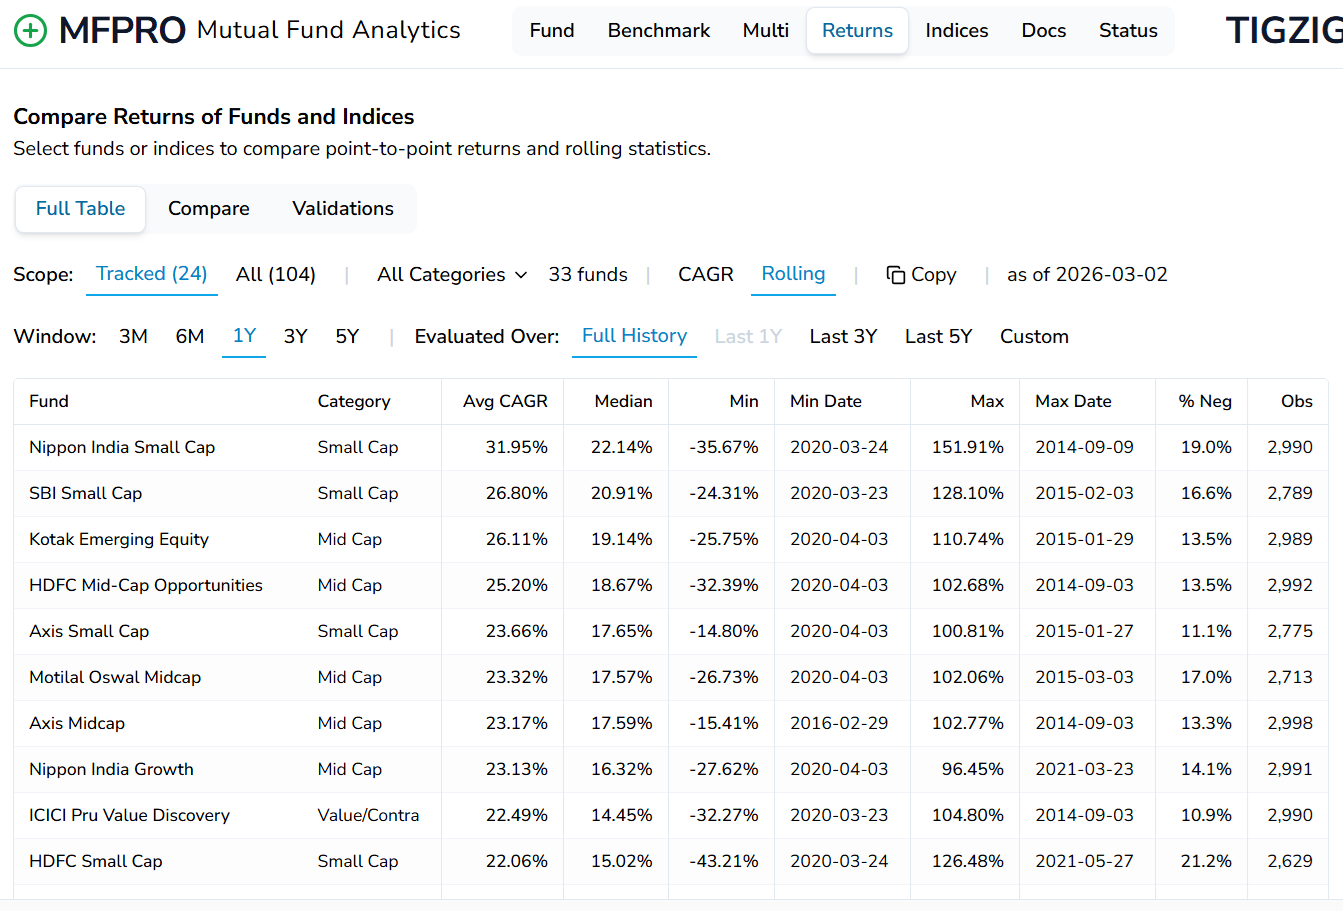
Now live - MFPRO v2 - Mutual Fund Analytics (India) - now with rolling returns, custom eval periods, multi-period & multi-instrument comparisons
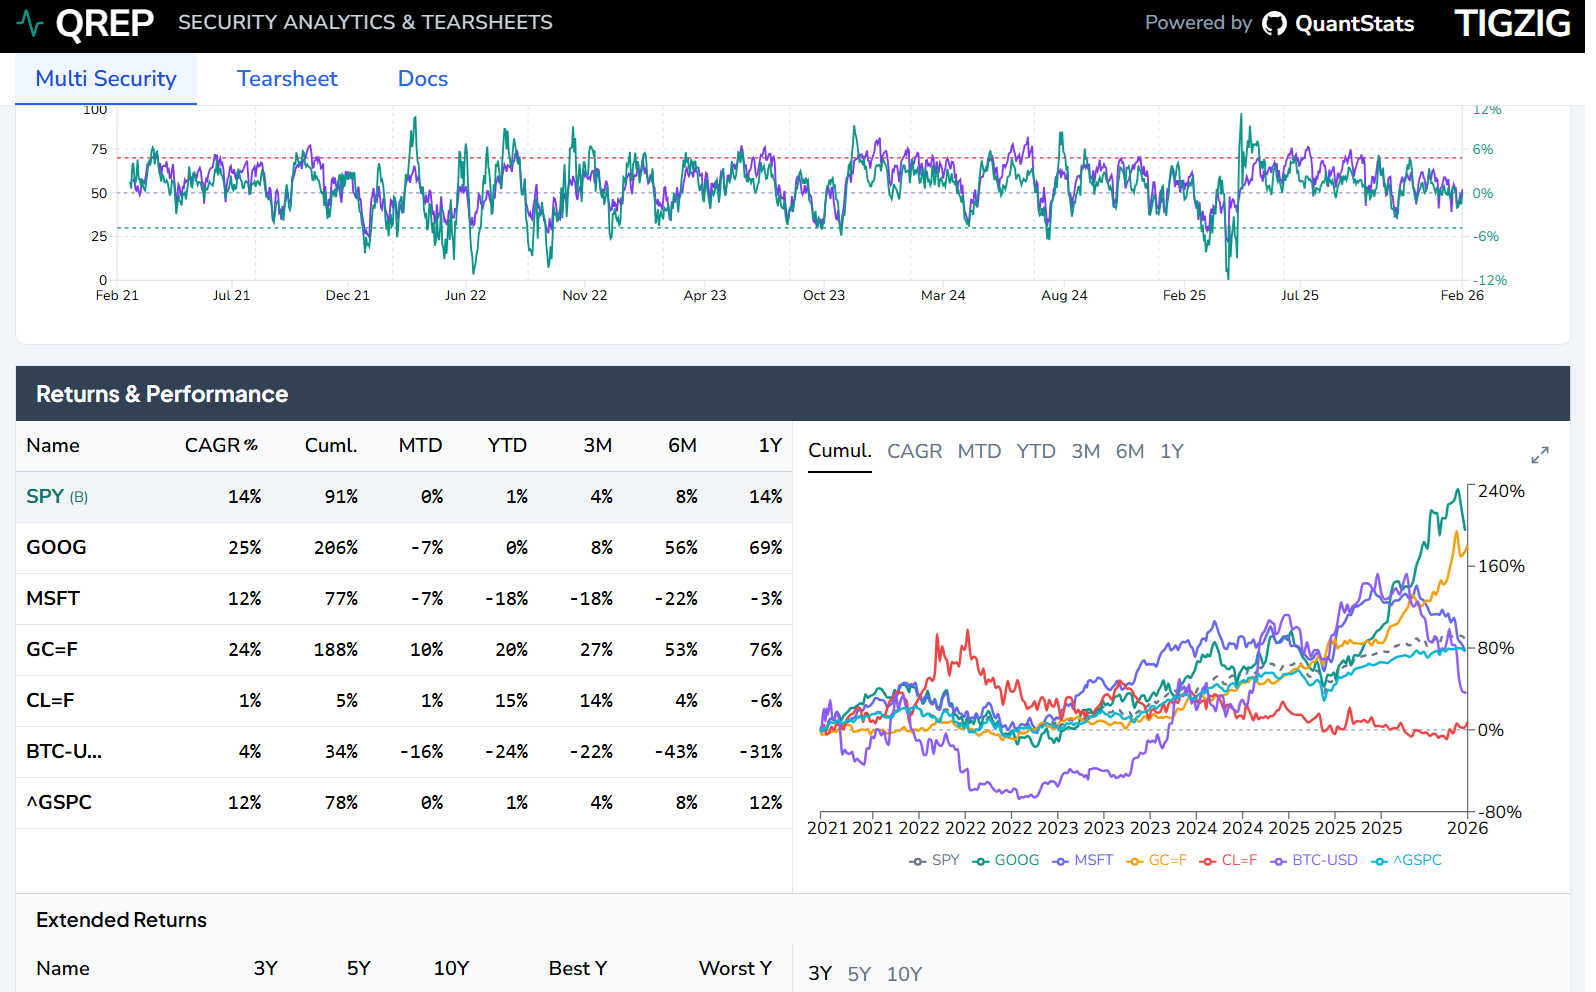
QRep - Powered by QuantStats. Live Now.