Index at a Record. Peak Valuation. Record-Low Sentiment. Last Two Times This Setup Held - 2000 and 2007 - the Market Halved.
Published: June 8, 2026
Index at a record. Peak valuation. Lowest sentiments. And the economy cracking. Last two times the market was priced up here, 2000 and 2007, it halved. I was in the markets both times.
In dot com it was all about page views with no line of sight on revenues. In 2026 it is all about compute and revenues with no line of sight on cash profitability.
I don't doubt the potential of AI, just the existing stock valuations.
I put this out about a month back, when the S&P was at a fresh all-time high - 7,400 .. the 'Irrational Exuberance' note..
Consumer delinquencies running high, Unemployment running high, producer prices at their hottest in 25 years (excl. covid), oil and gasoline high and consumer streteched. And seven stocks doing most of the lifting in the index.
Dimon called it too much exuberance. Buffett's sitting on the biggest cash pile in Berkshire's history.
Where to go next
- More analysis: tigzig.com → Analysis
- Run your own cuts: tigzig.com → Market Tools
- Or have your AI agent do it: point Claude, Codex, any AI at agents.tigzig.com
Full One-Pager Content (Text Format)
The image above as accessible text - same content, indexable by search engines and AI agents.
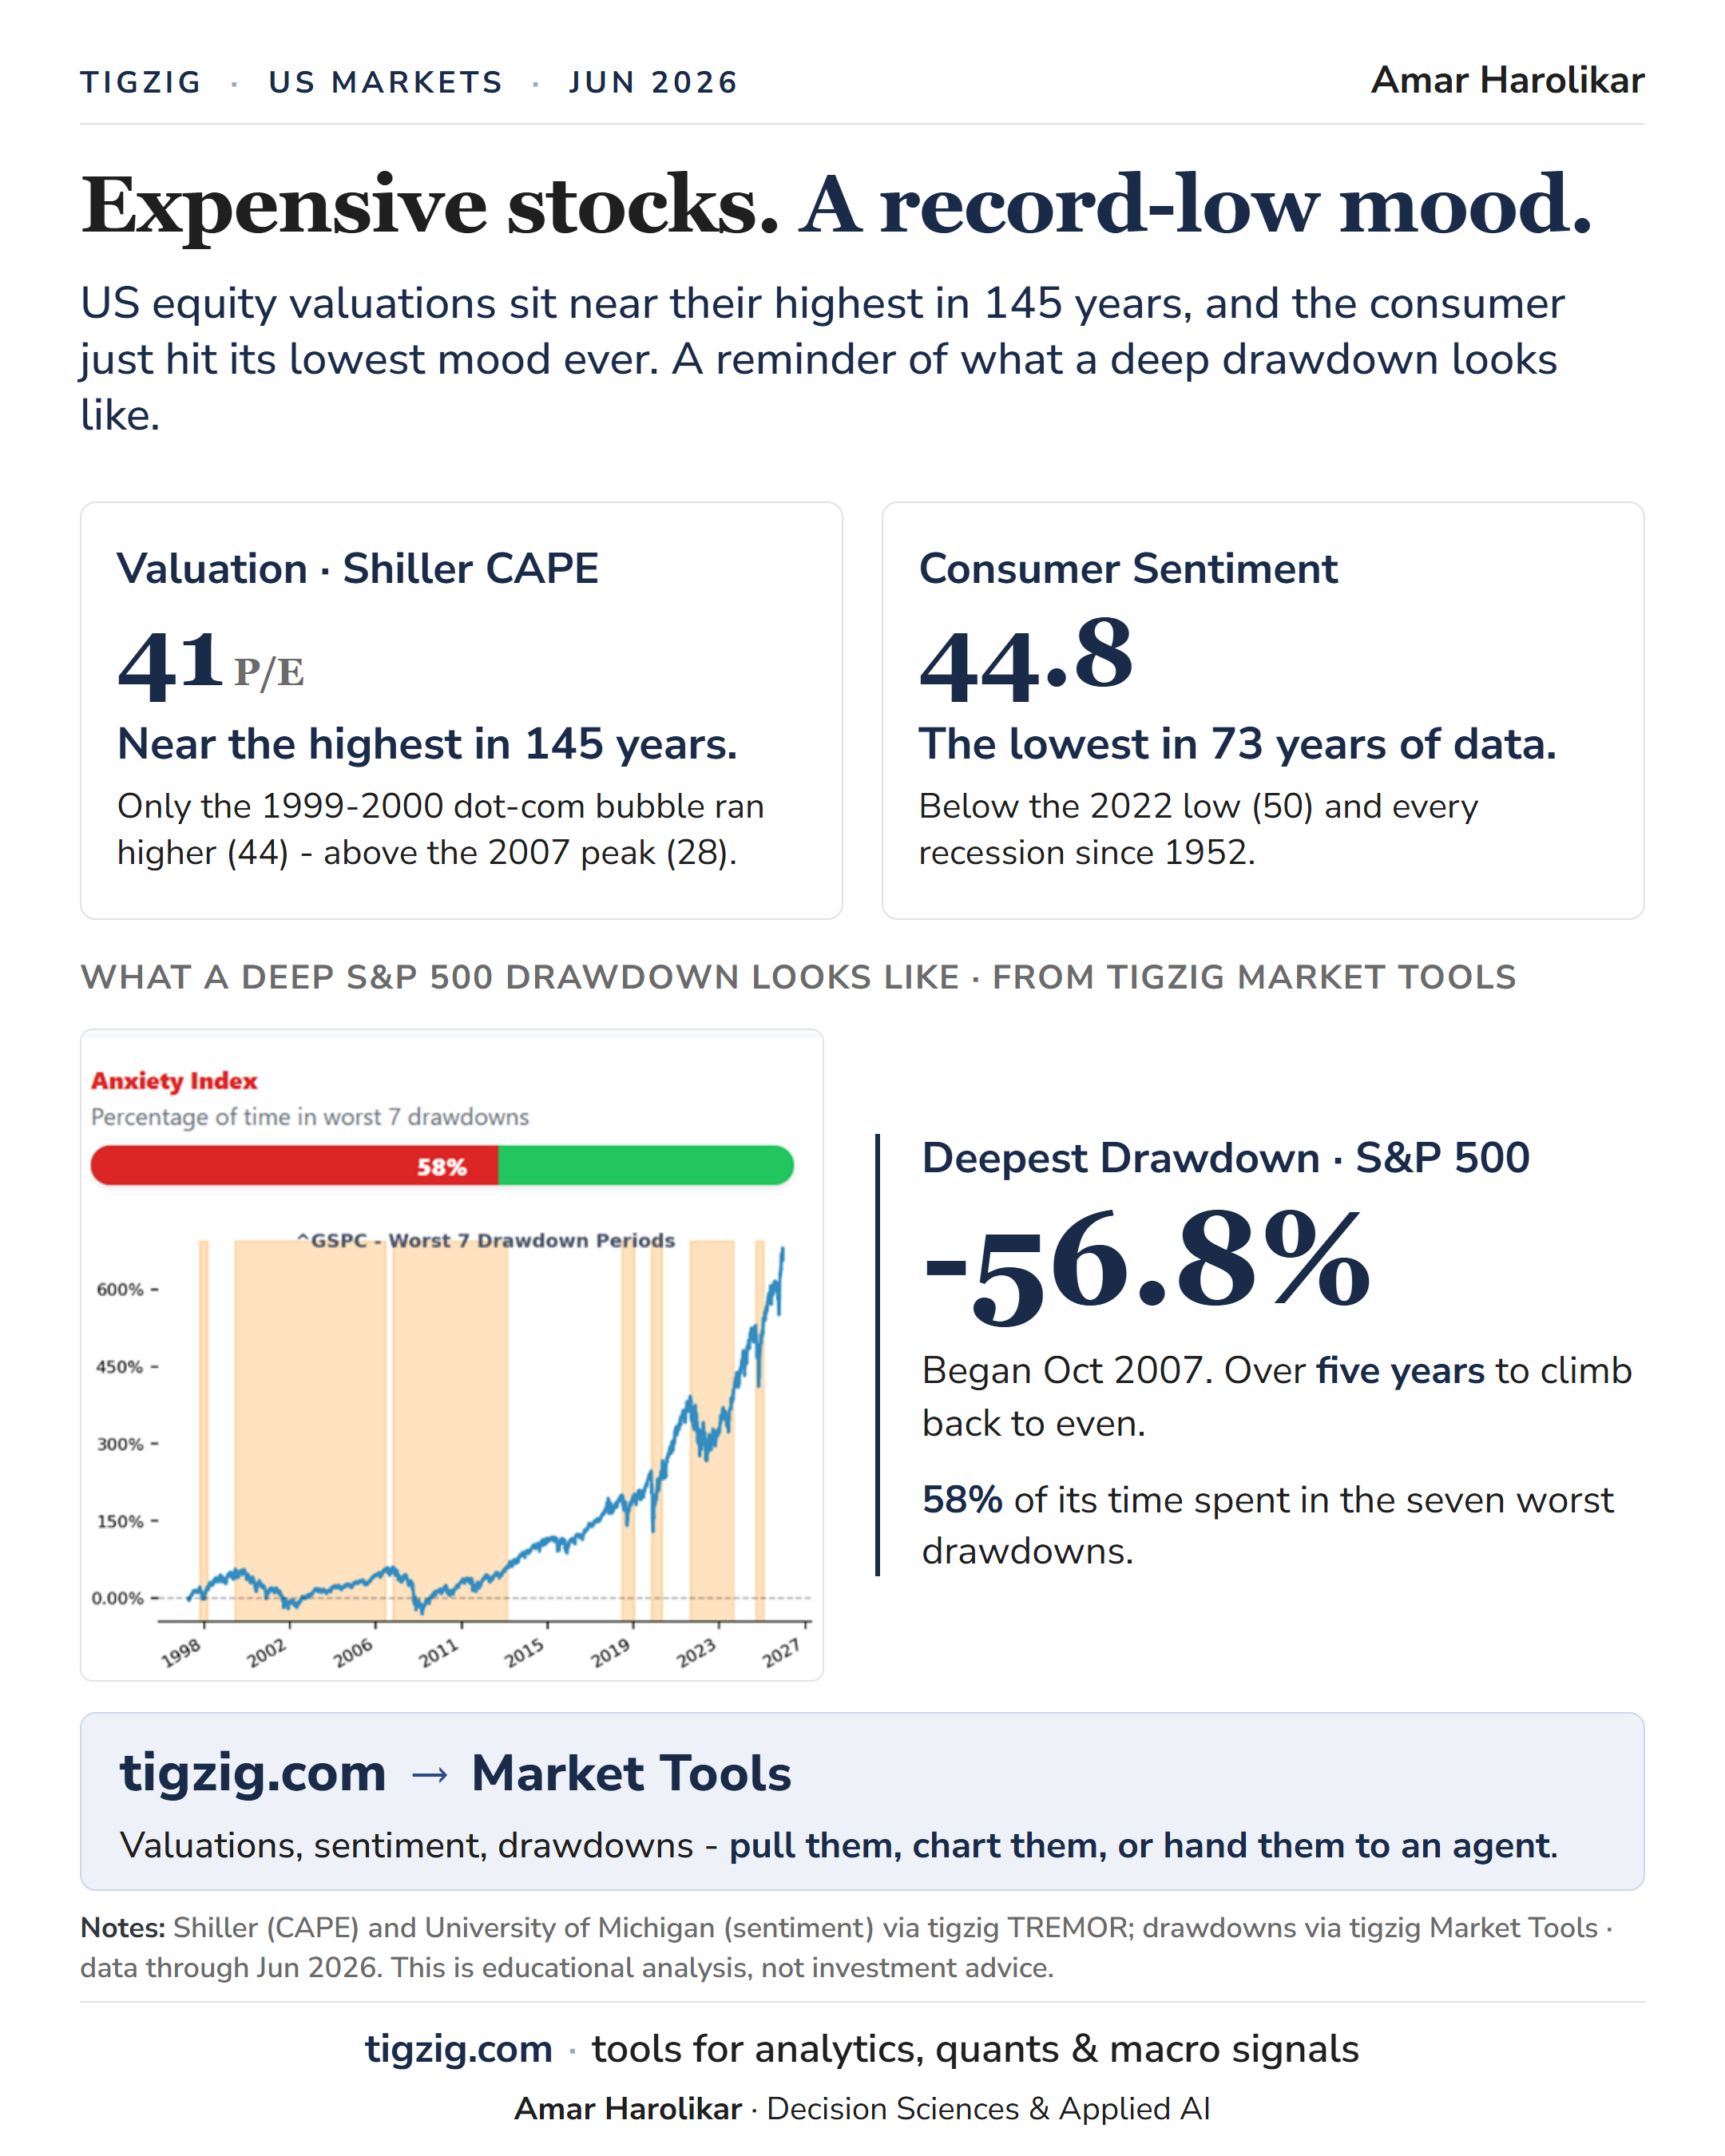
TIGZIG · US MARKETS · JUN 2026 | Amar Harolikar
Expensive stocks. A record-low mood.
US equity valuations sit near their highest in 145 years, and the consumer just hit its lowest mood ever. A reminder of what a deep drawdown looks like.
Valuation · Shiller CAPE
41 P/E
Near the highest in 145 years. Only the 1999-2000 dot-com bubble ran higher (44) - above the 2007 peak (28).
Consumer Sentiment
44.8
The lowest in 73 years of data. Below the 2022 low (50) and every recession since 1952.
What a deep S&P 500 drawdown looks like · from tigzig Market Tools
Deepest Drawdown · S&P 500: -56.8%
- Began Oct 2007. Over five years to climb back to even.
- 58% of its time spent in the seven worst drawdowns.
Where to start
tigzig.com → Market Tools
Valuations, sentiment, drawdowns - pull them, chart them, or hand them to an agent.
Notes: Shiller (CAPE) and University of Michigan (sentiment) via tigzig TREMOR; drawdowns via tigzig Market Tools · data through Jun 2026. This is educational analysis, not investment advice.
tigzig.com · tools for analytics, quants & macro signals.
Amar Harolikar · Decision Sciences & Applied AI.